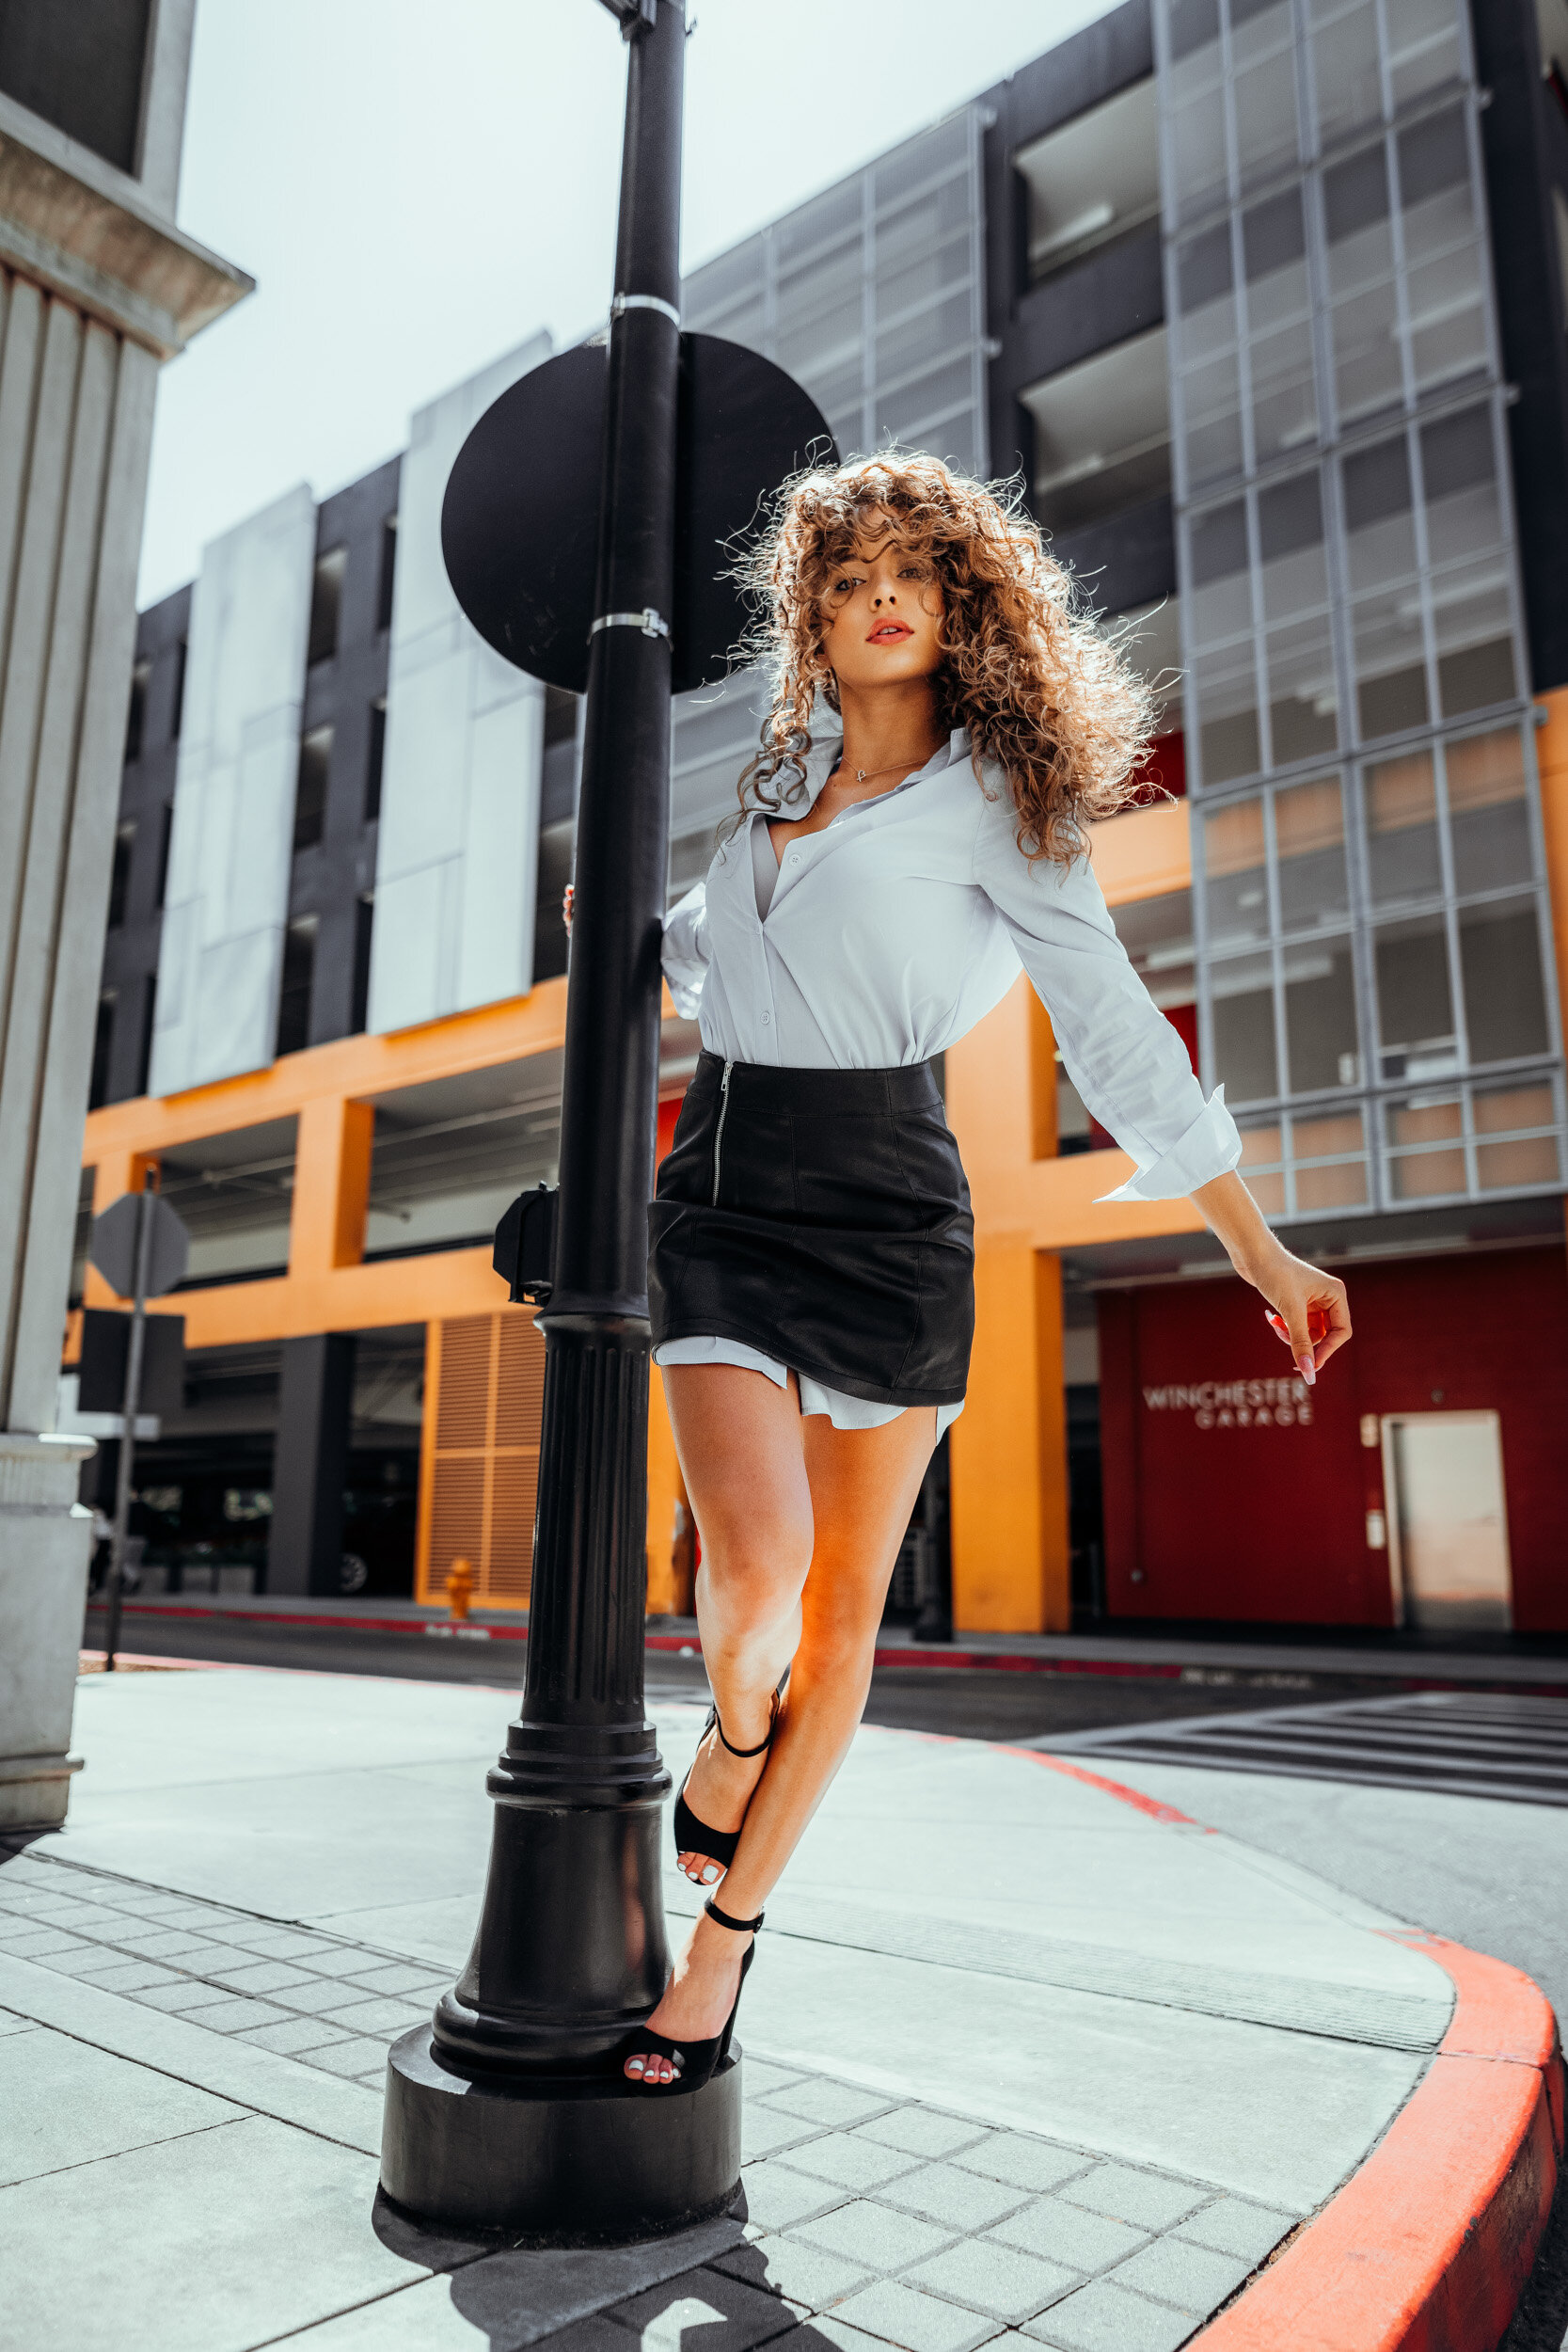
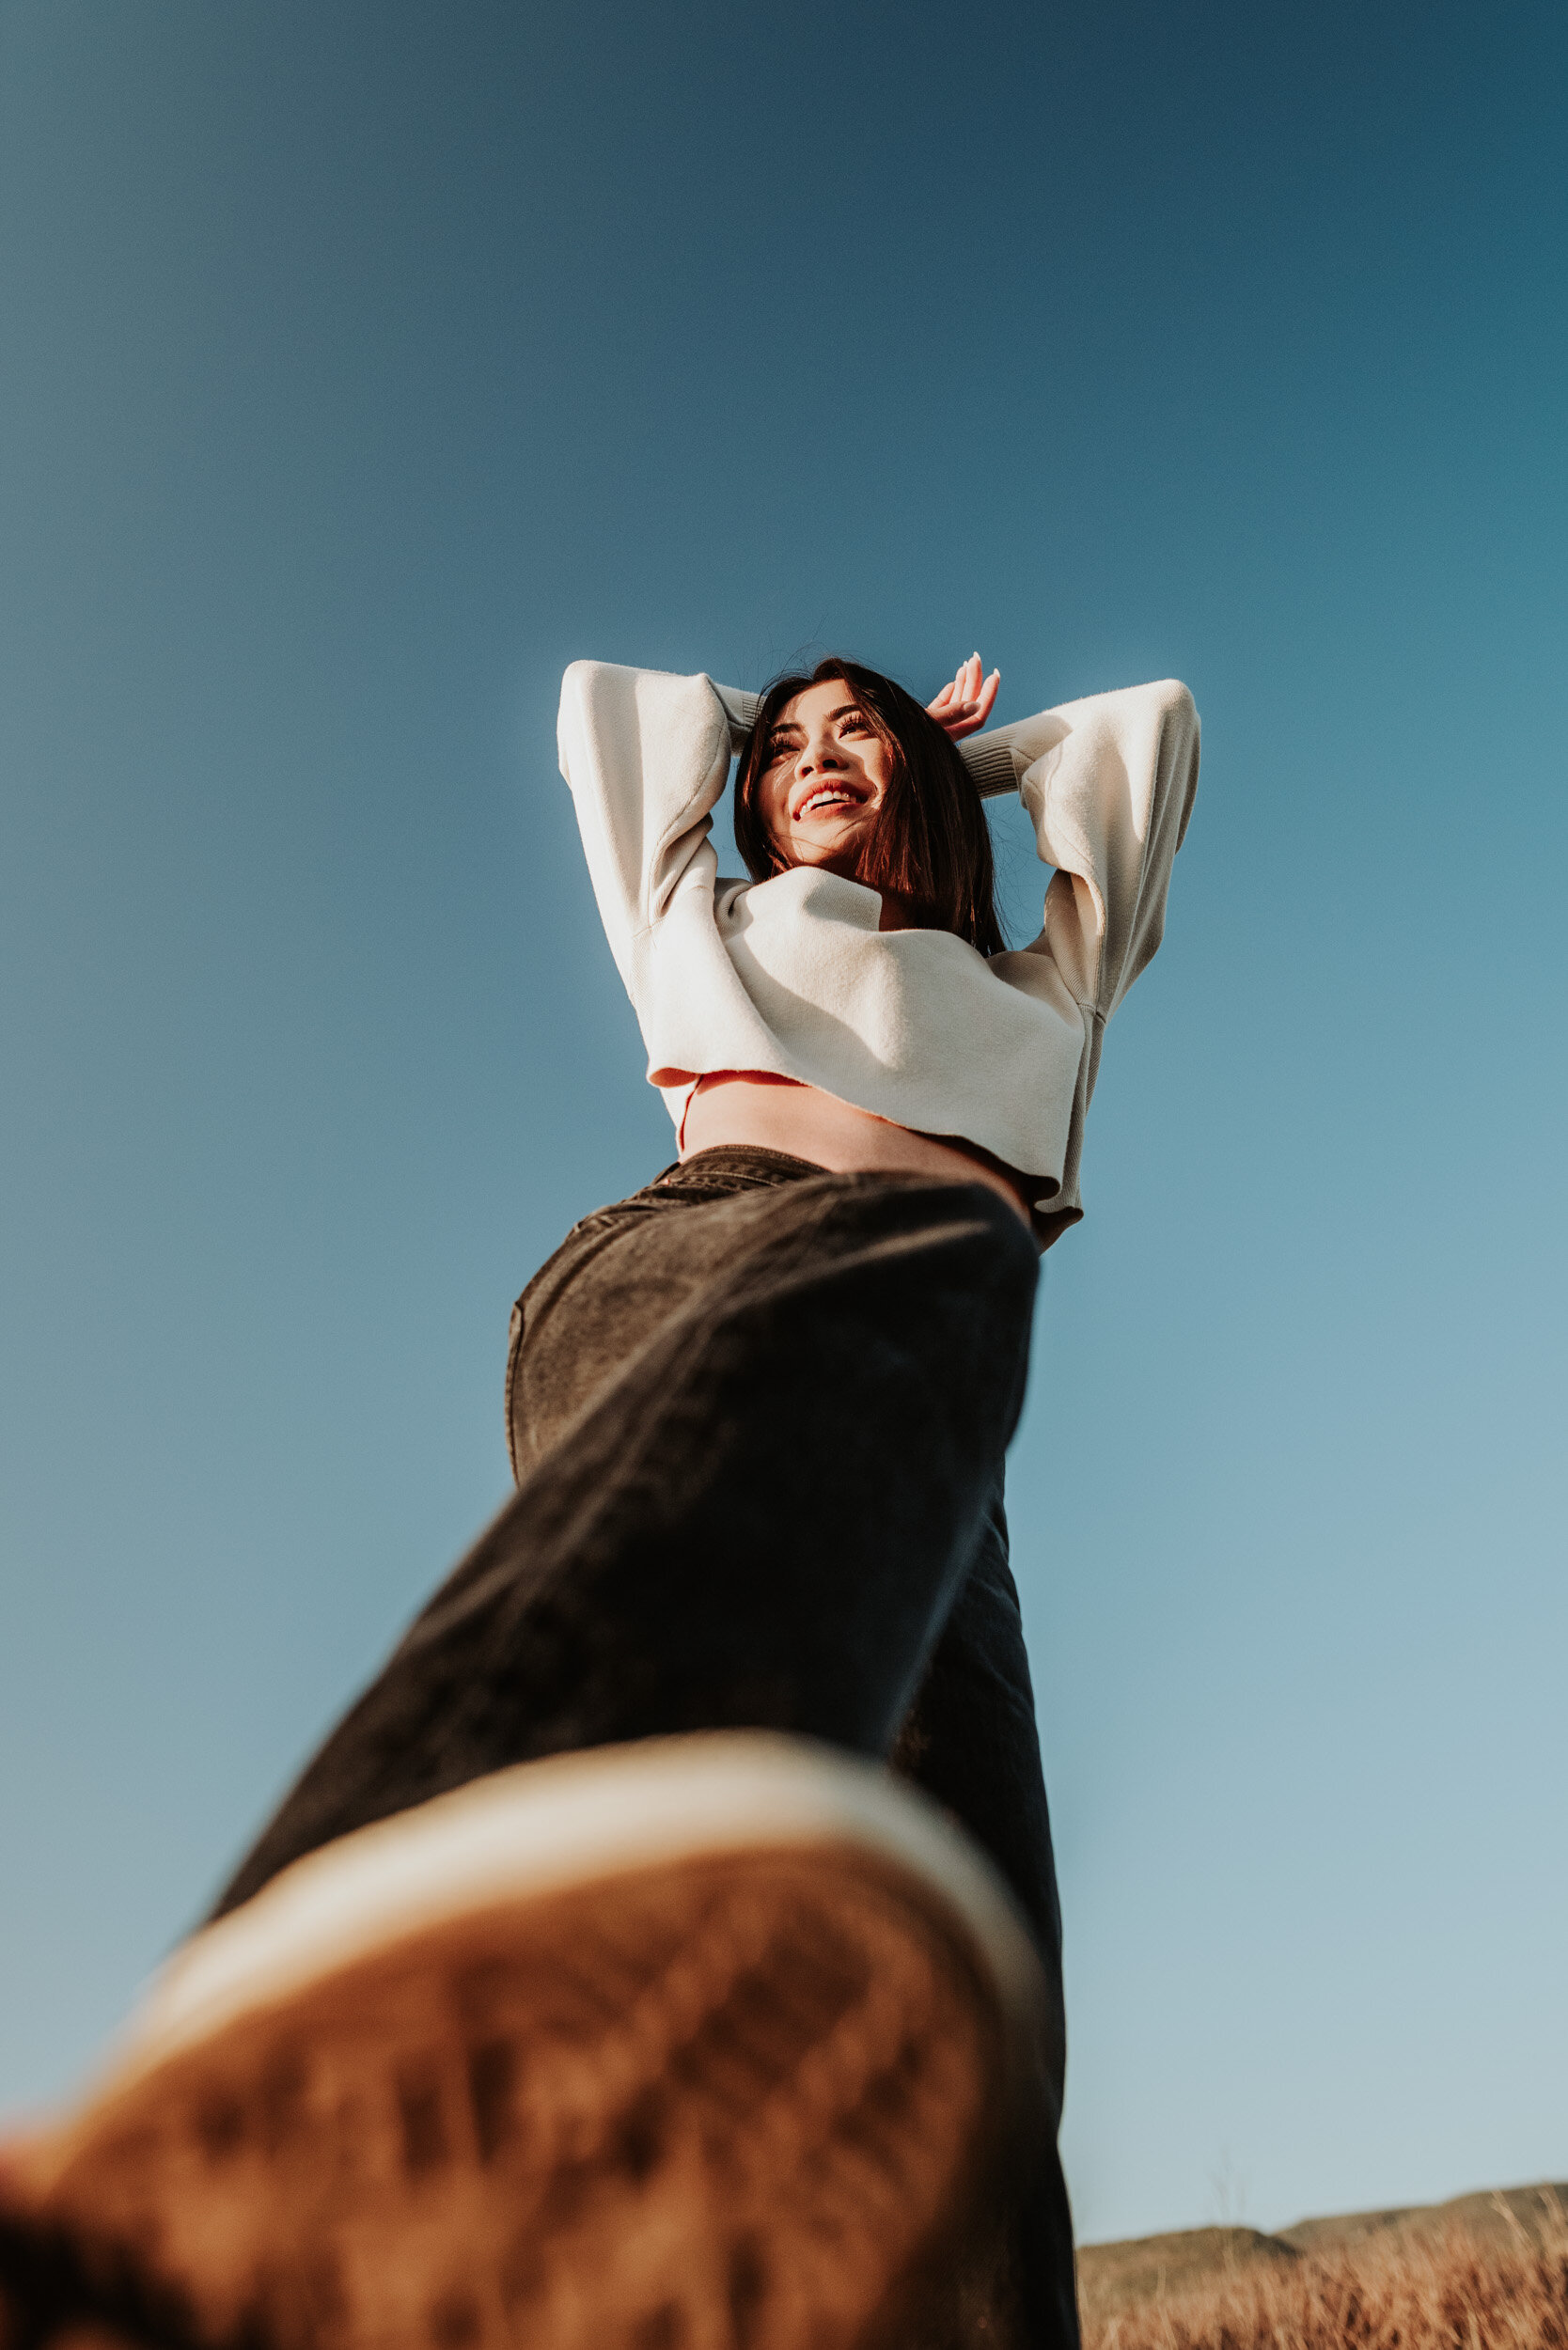
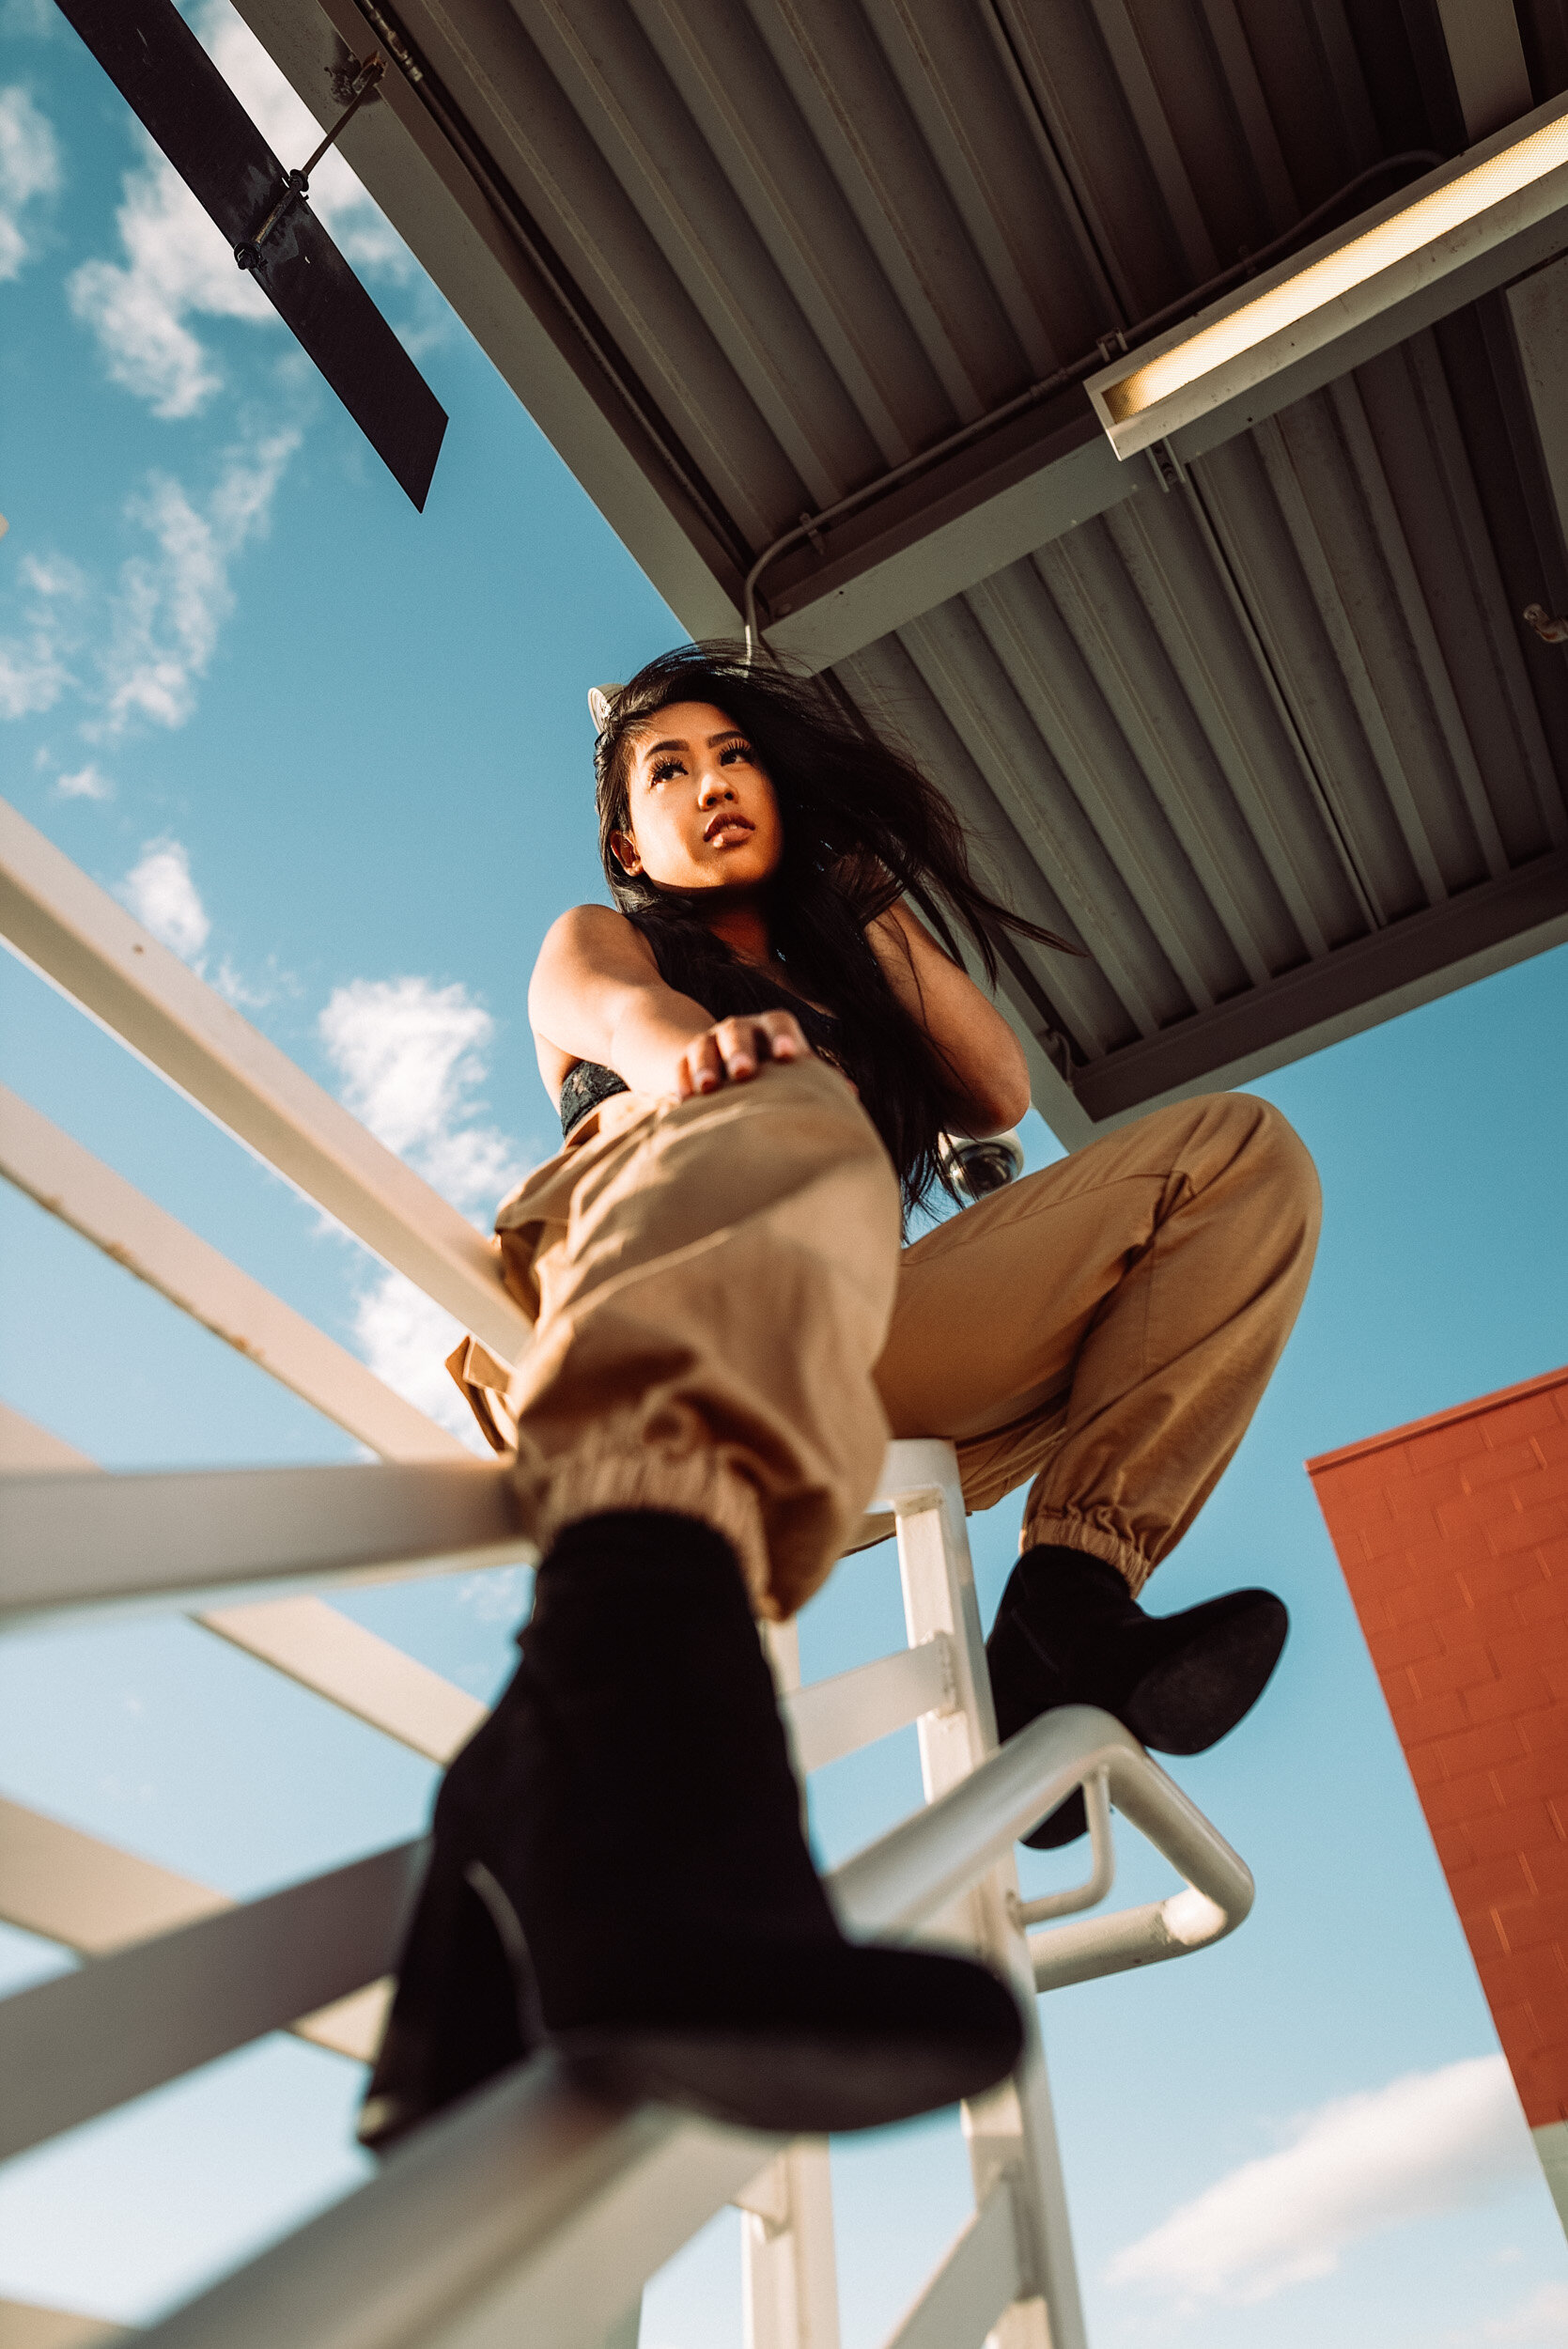
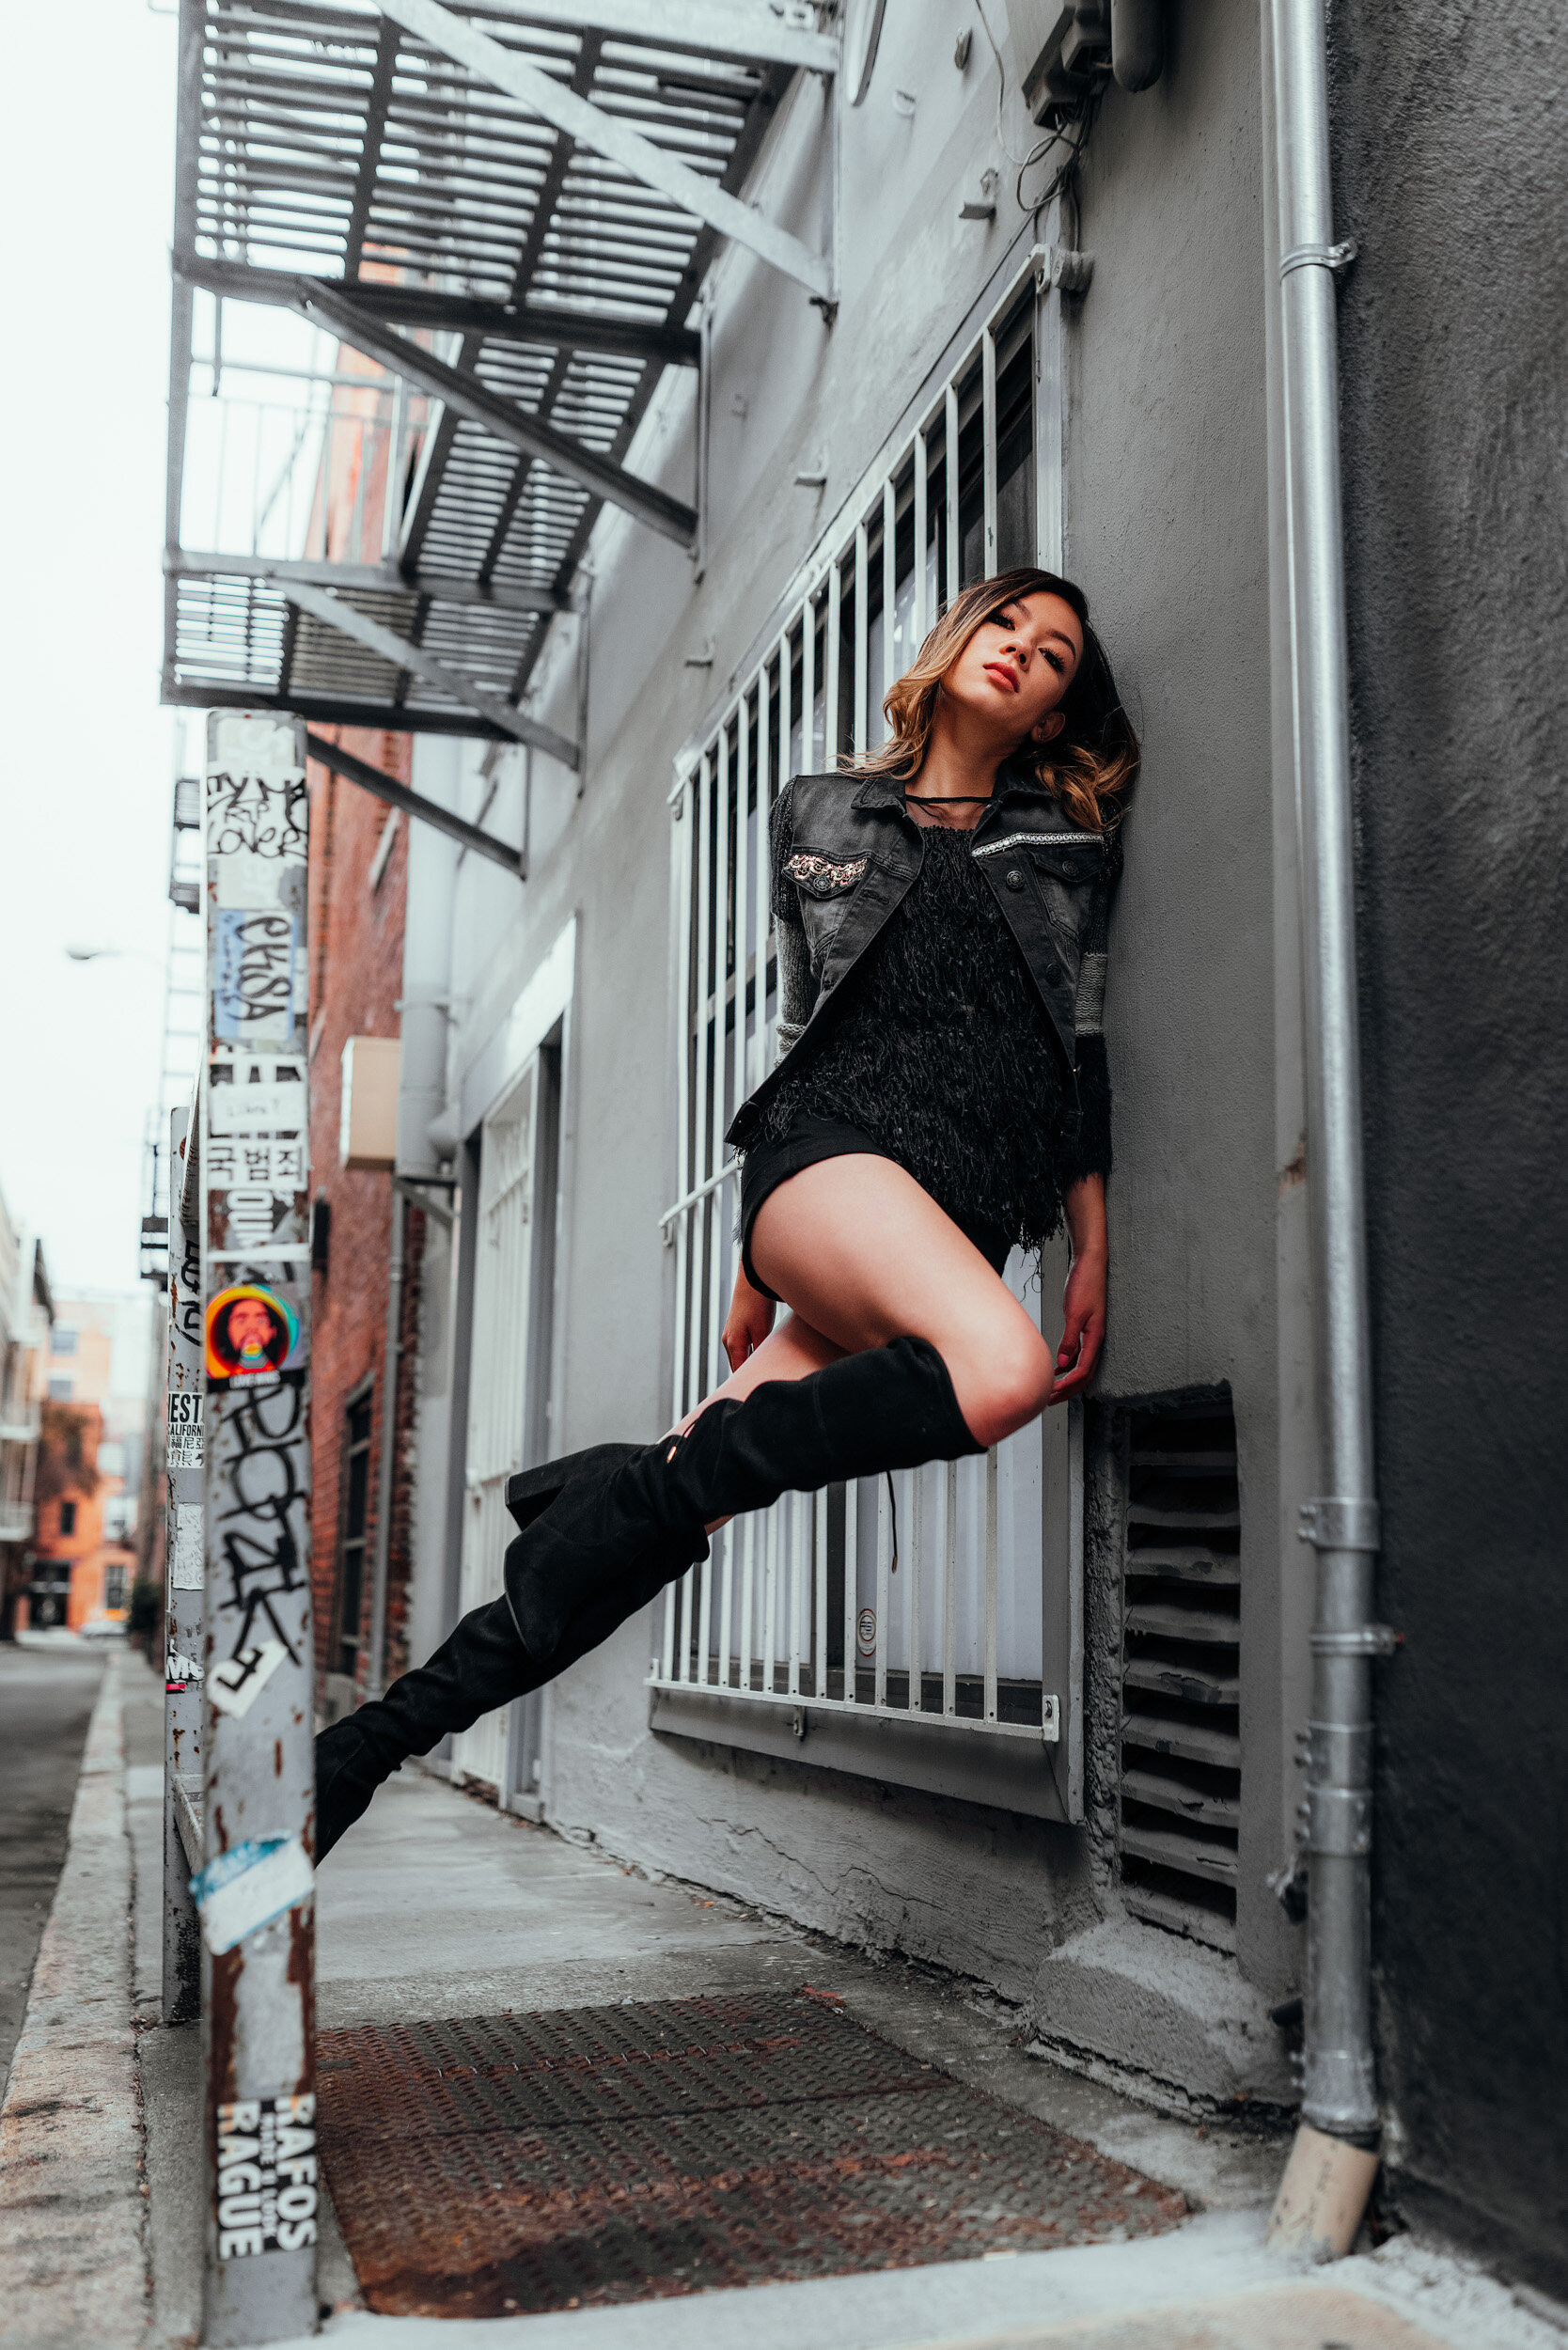
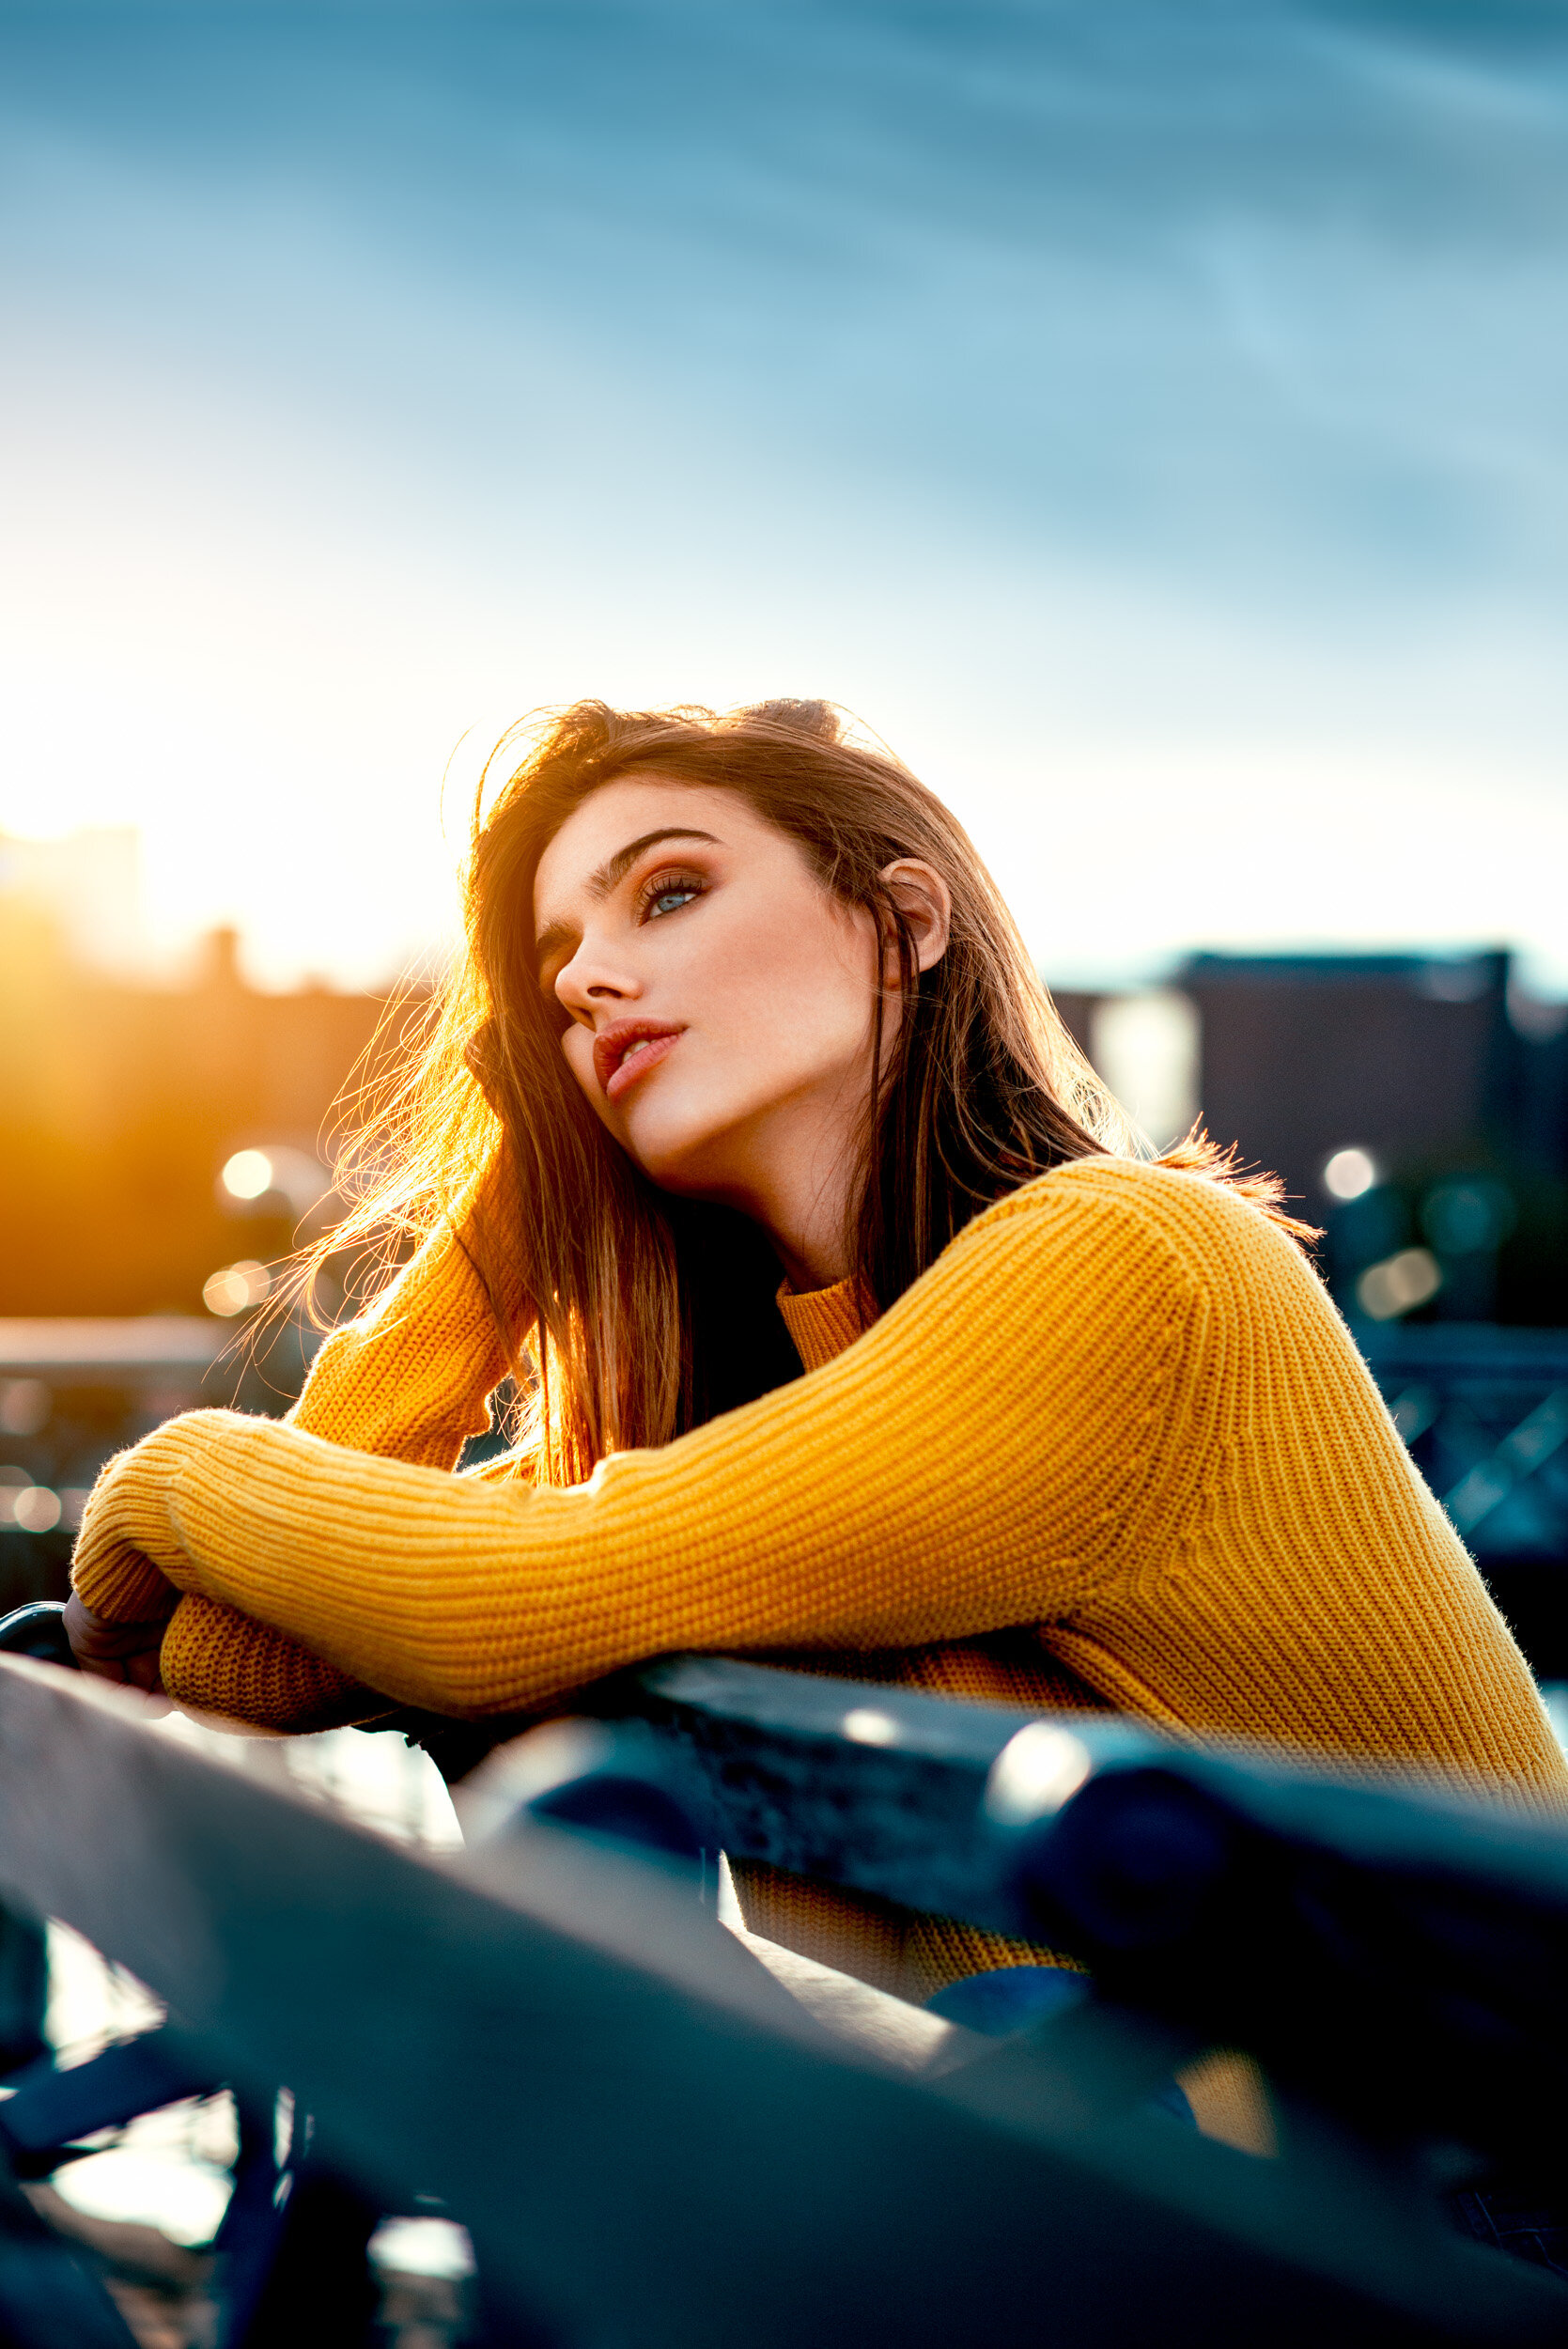
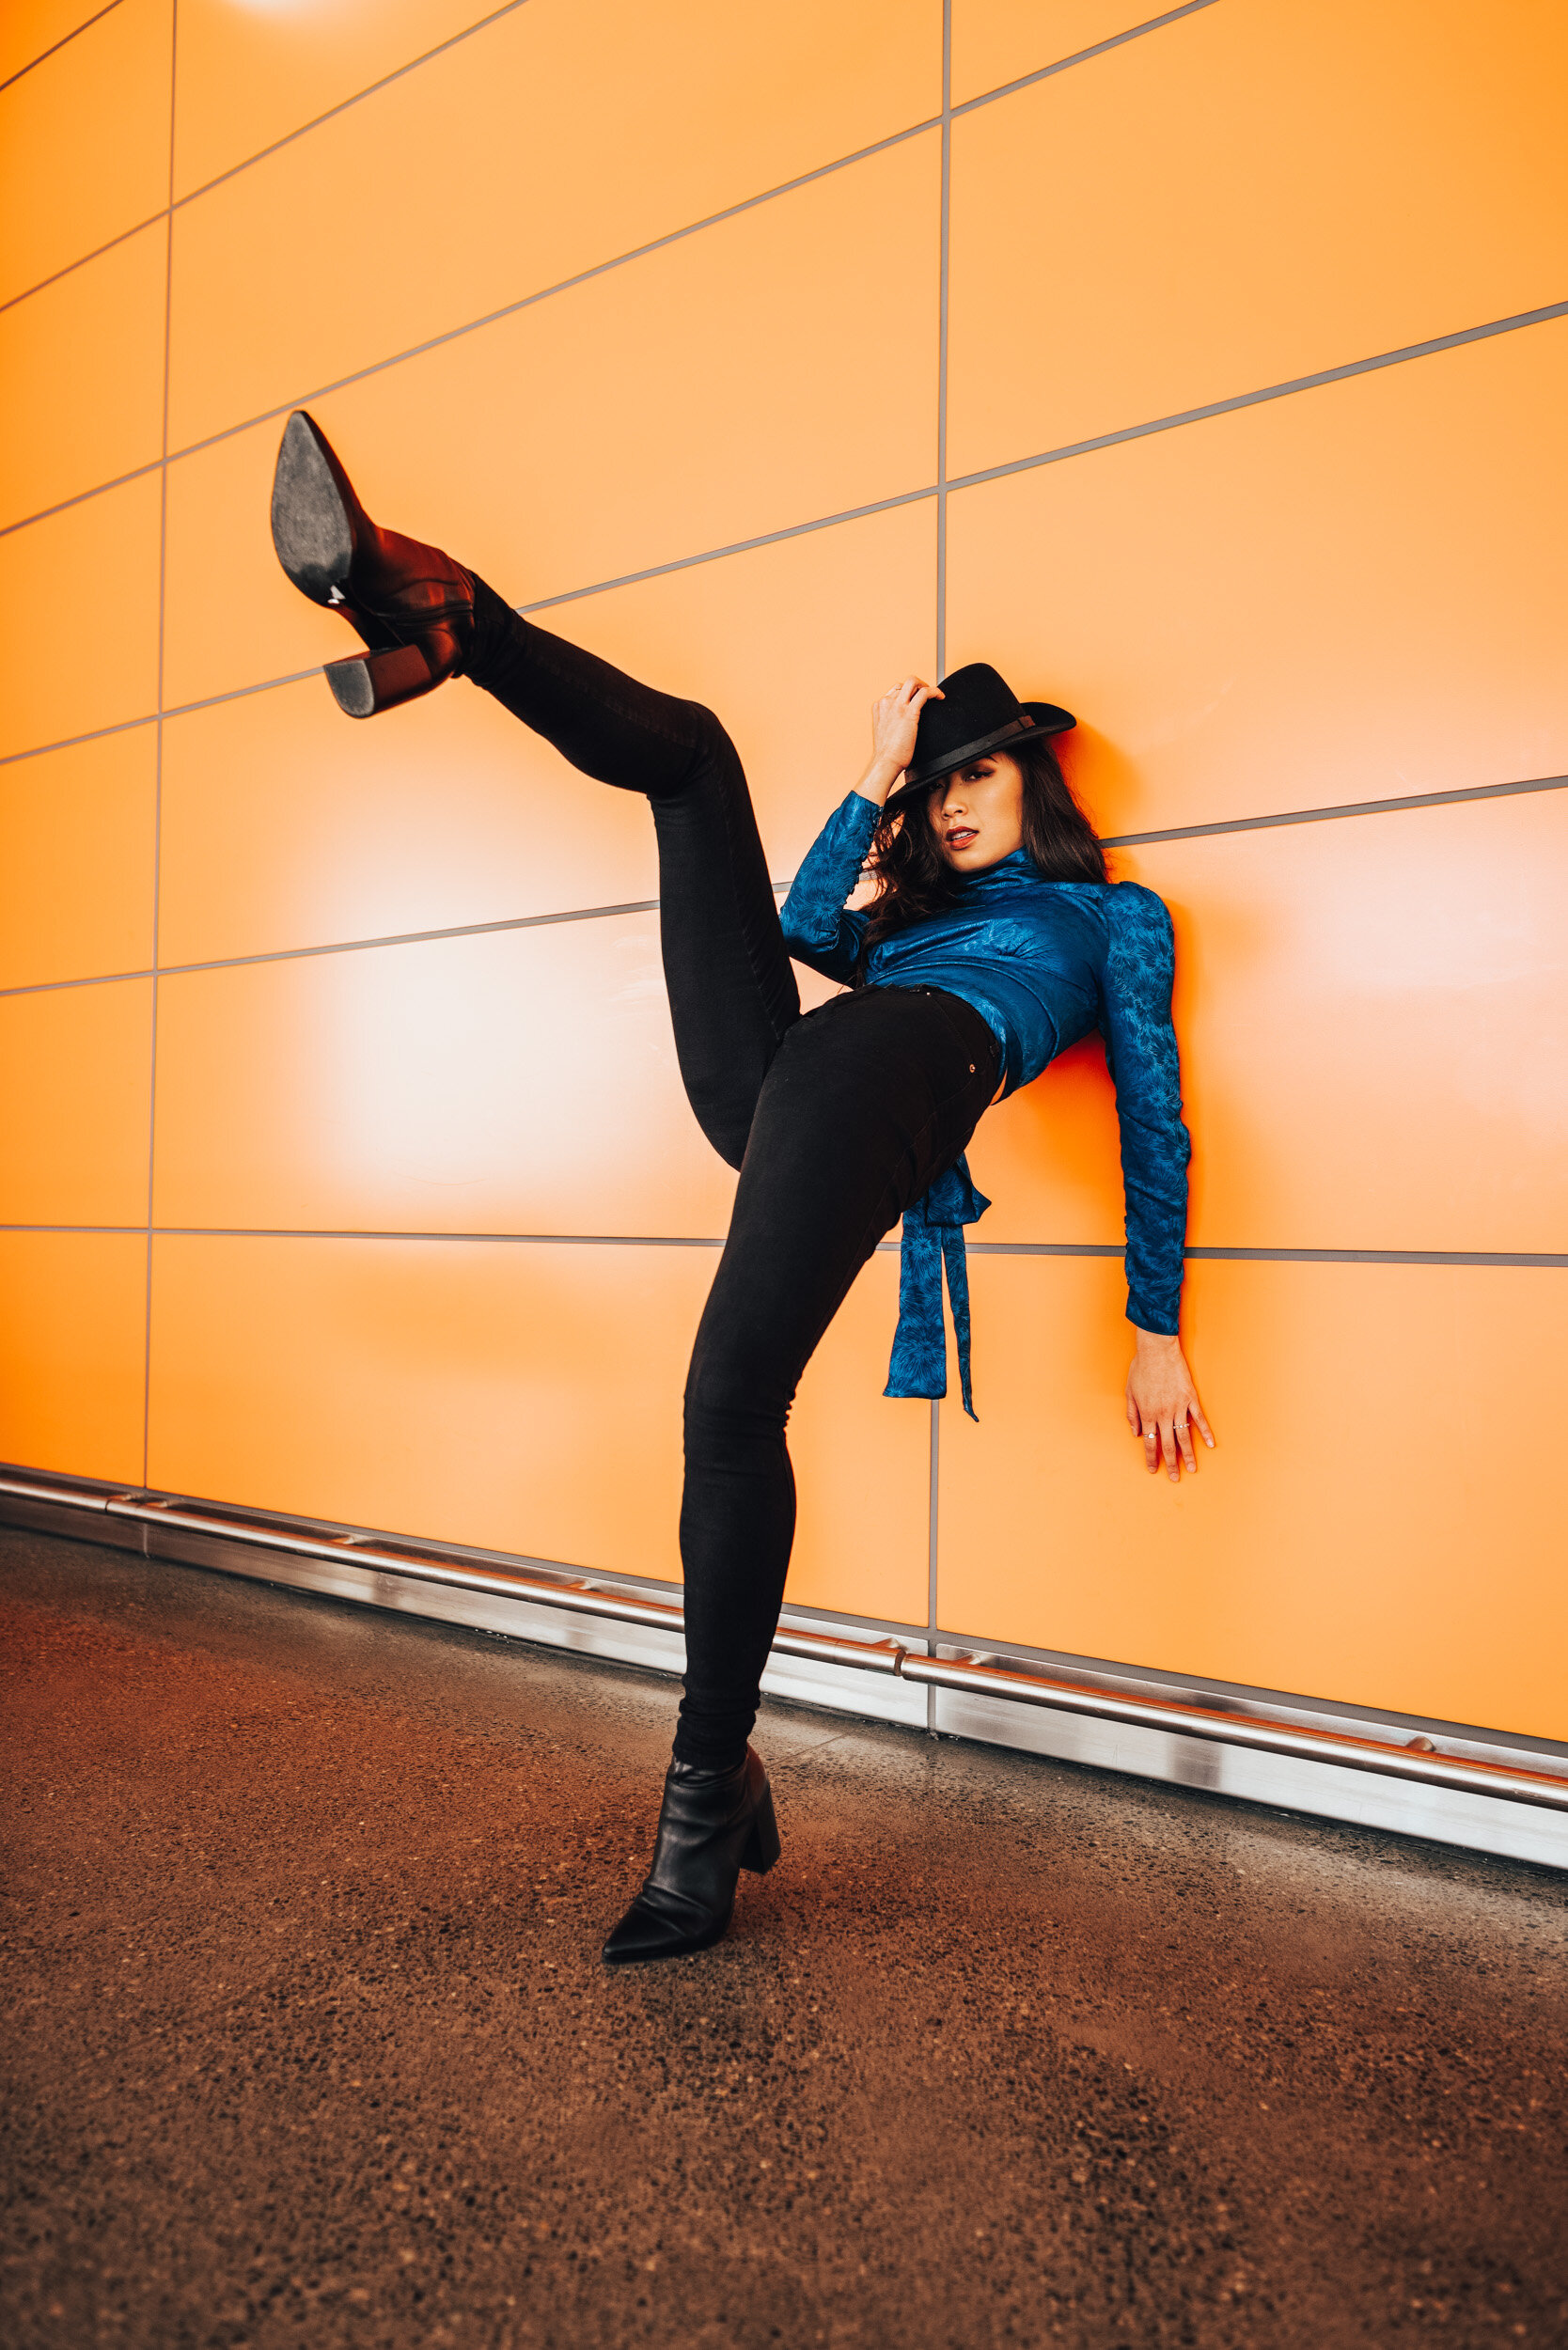
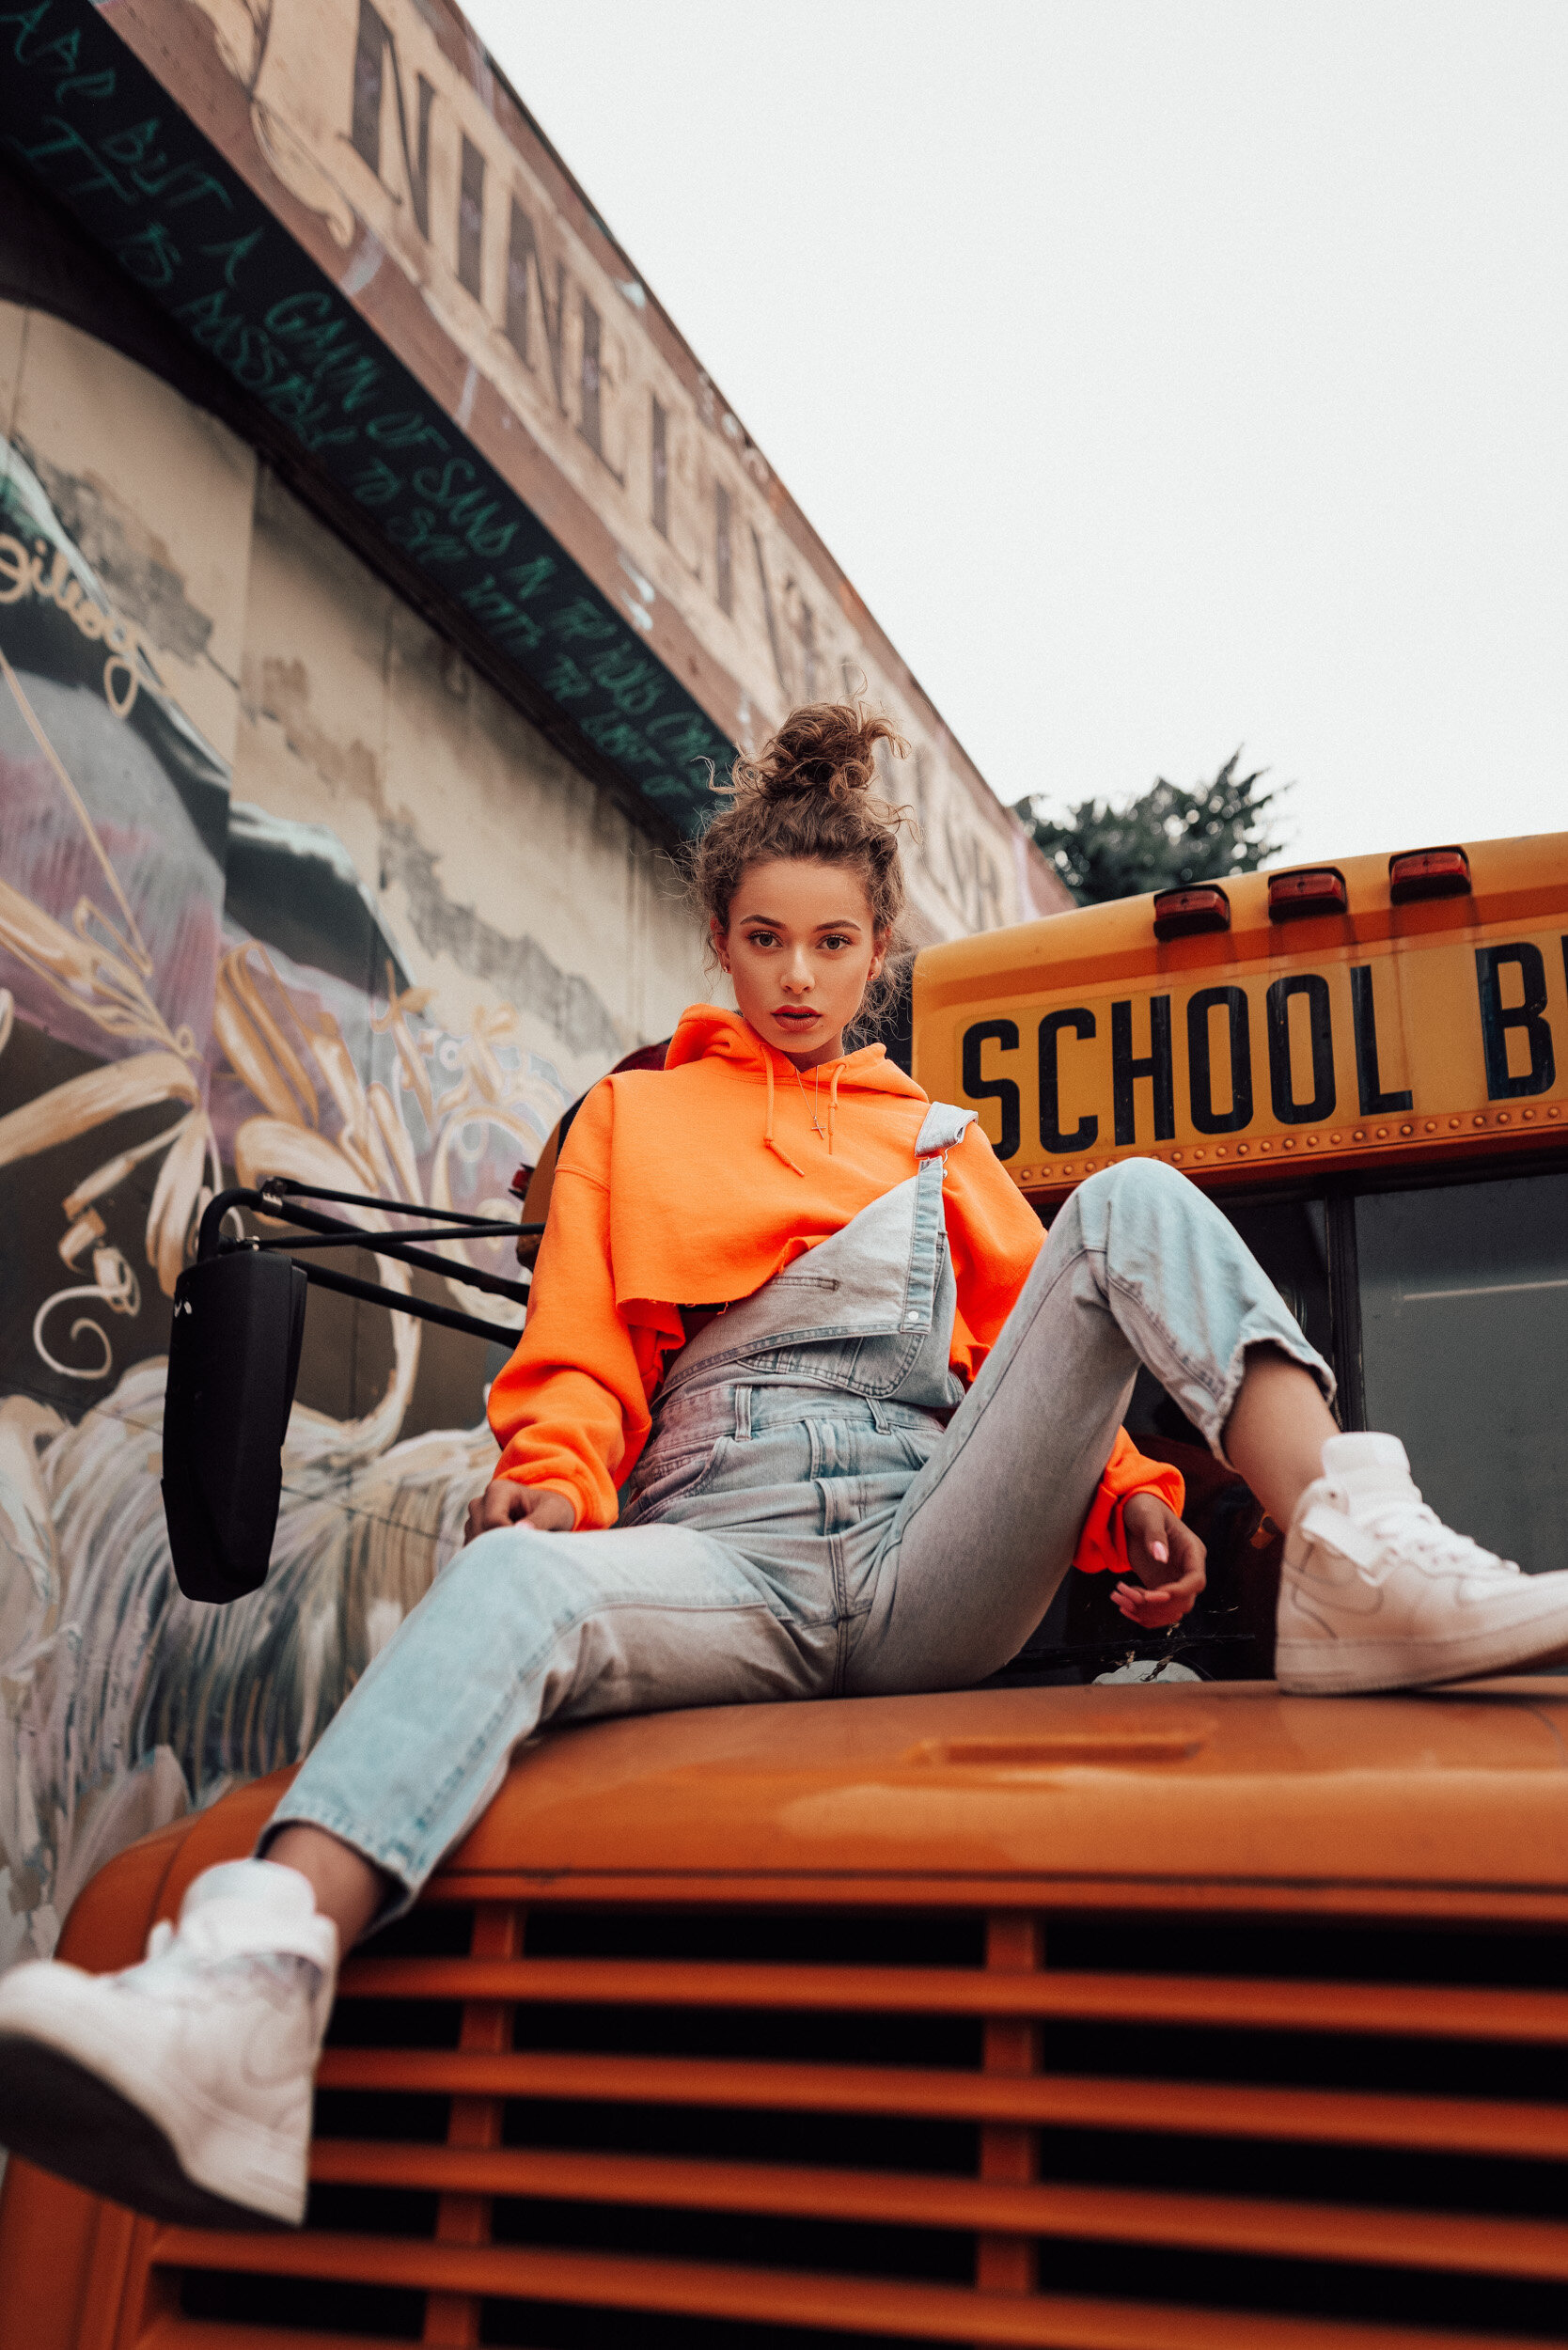
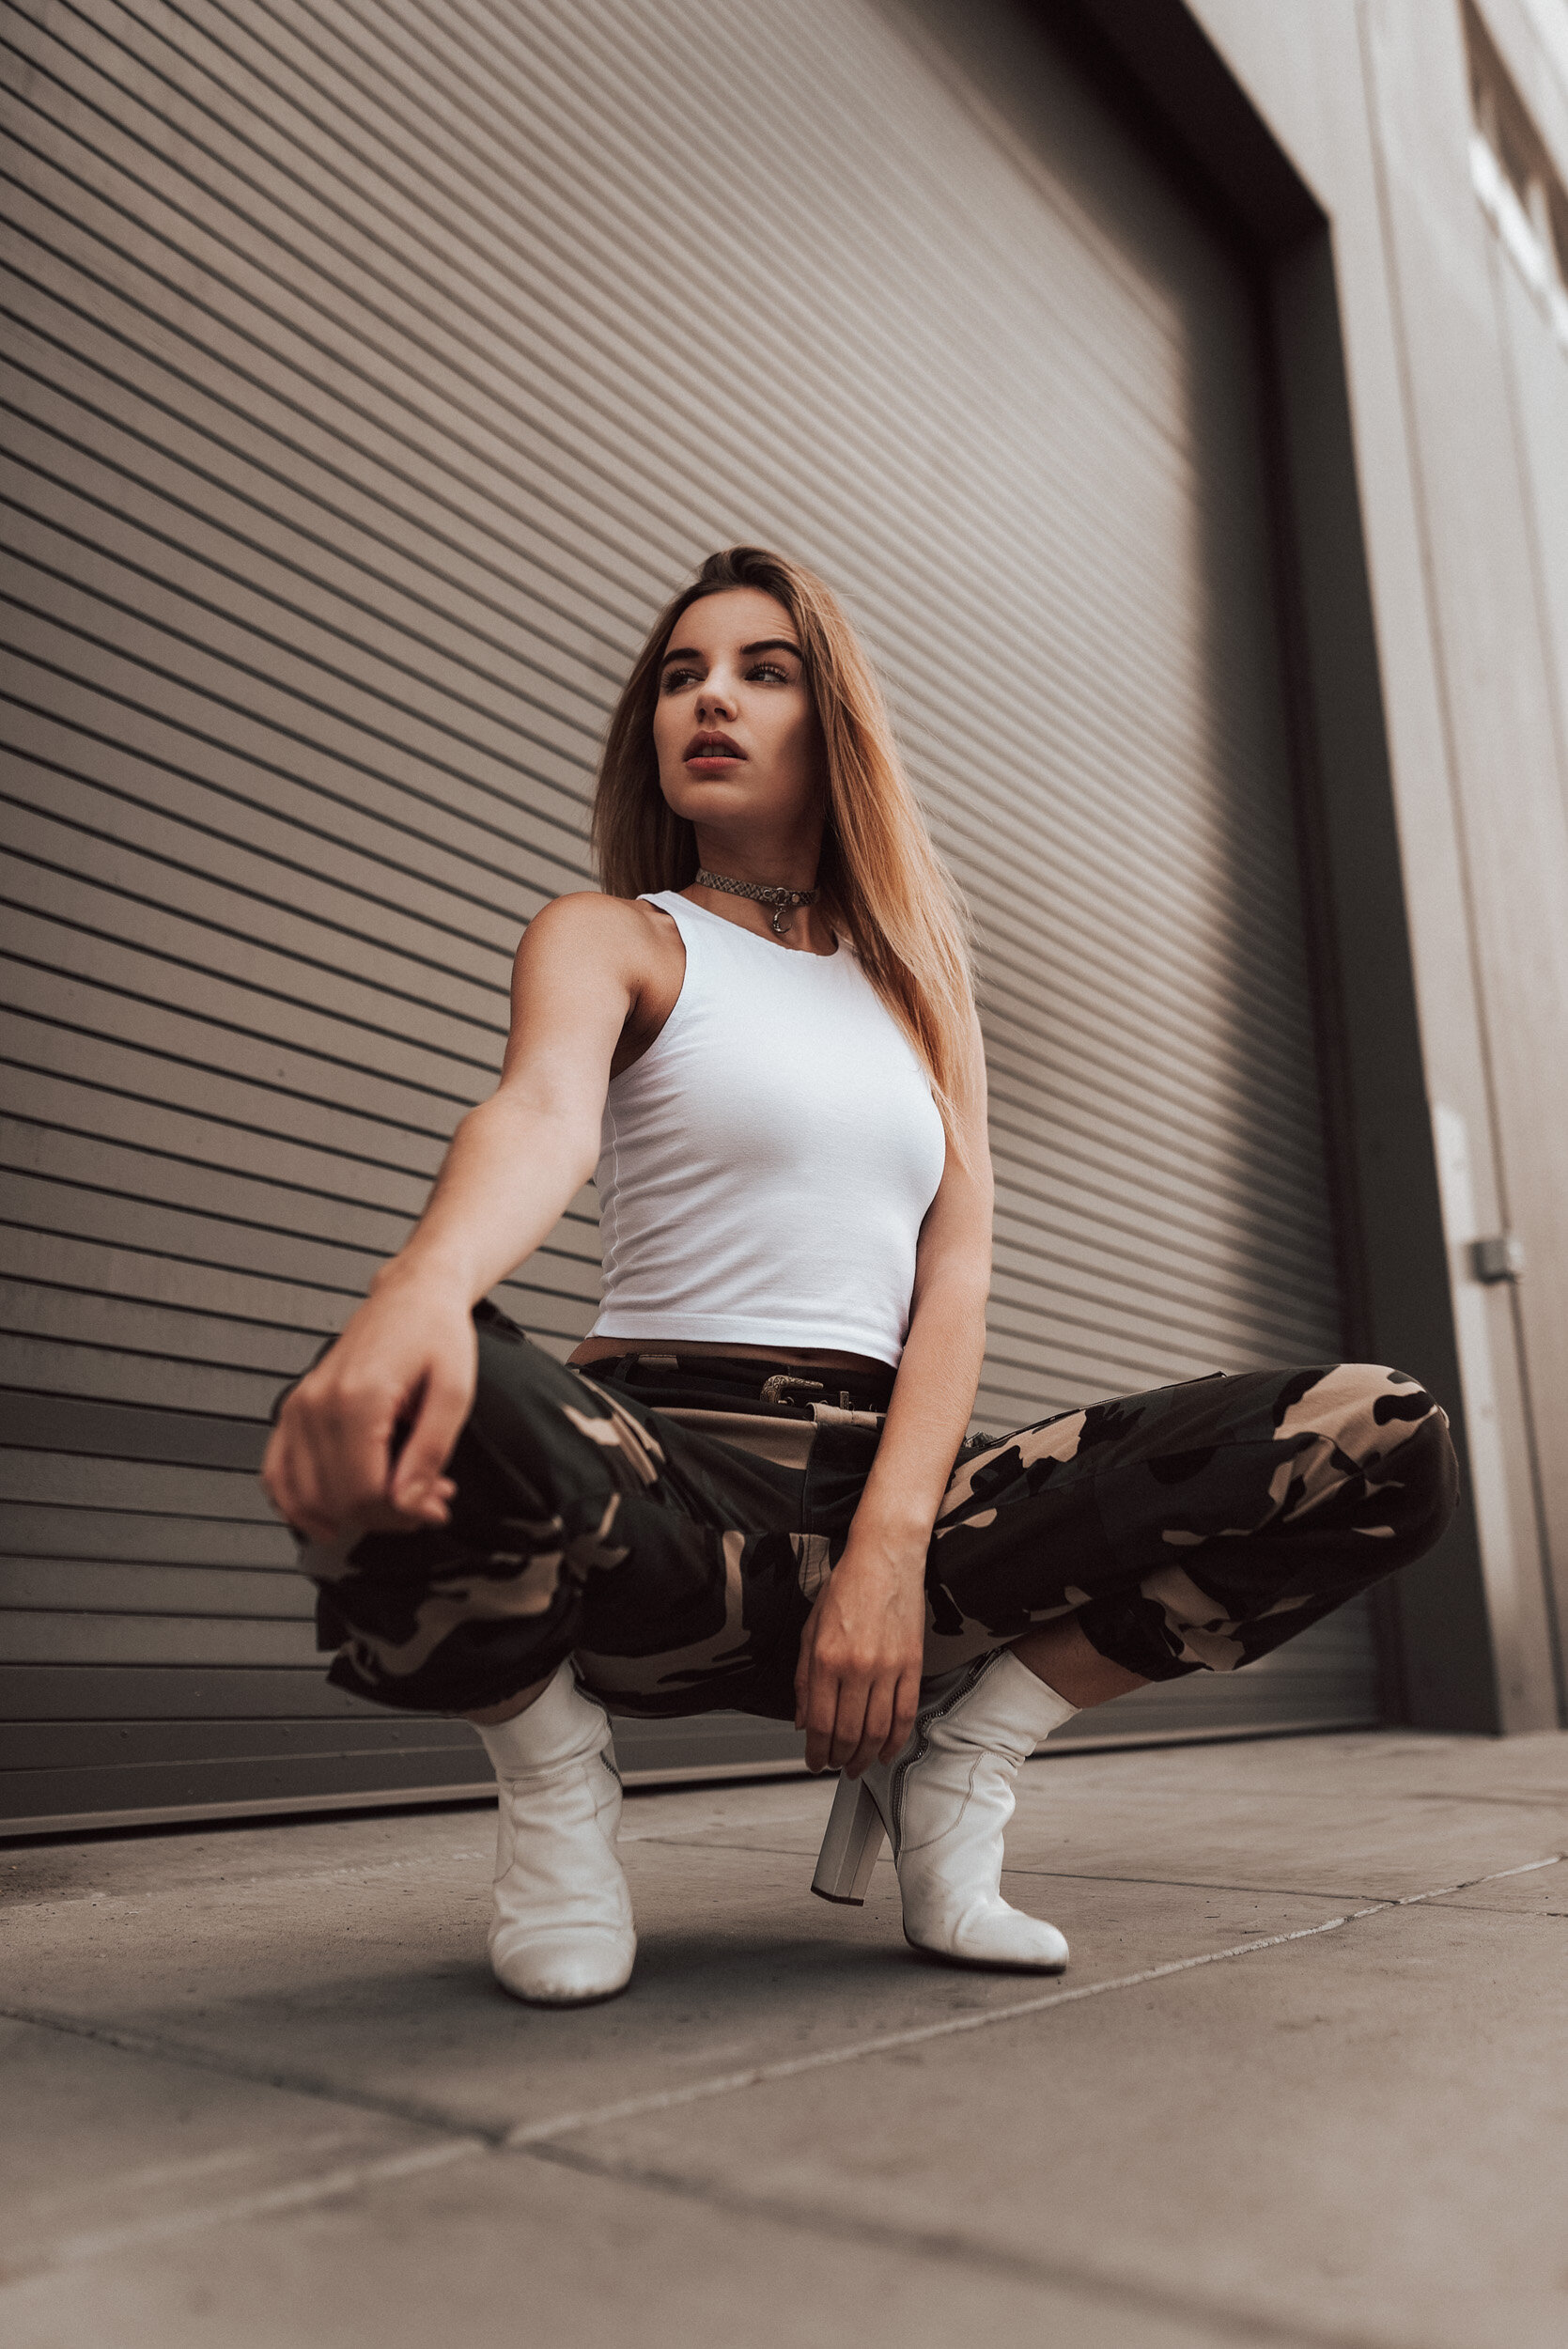
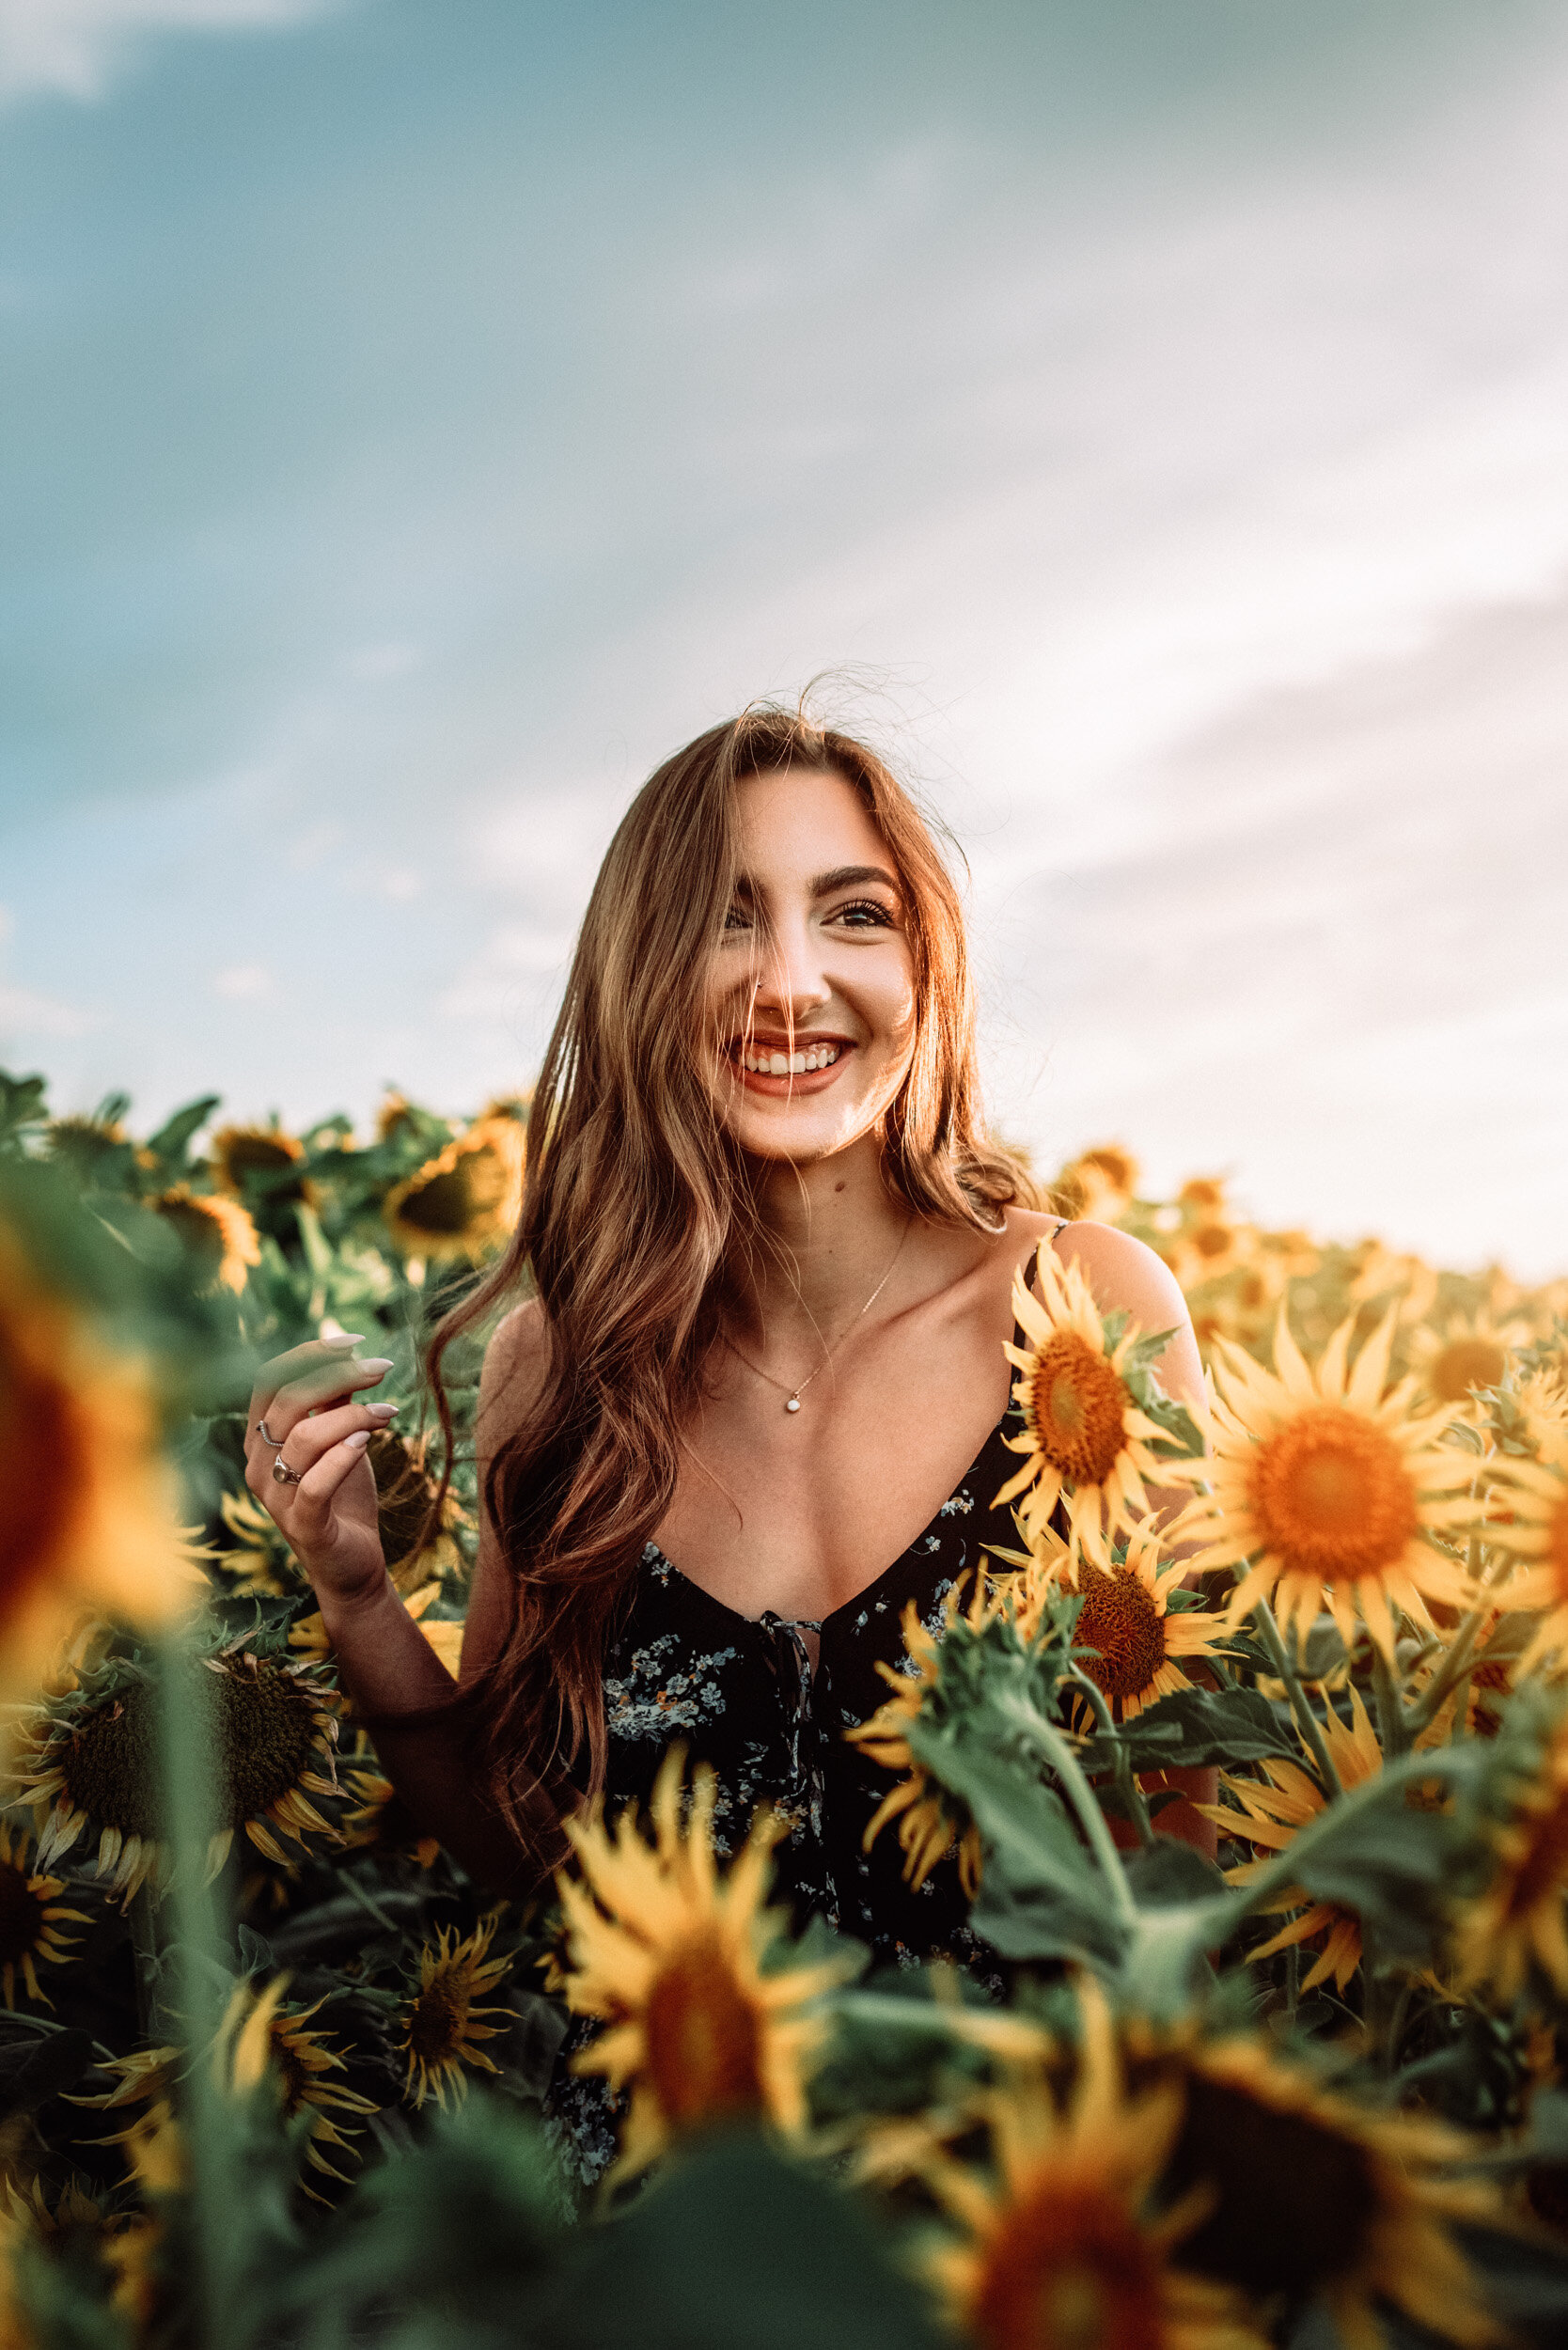
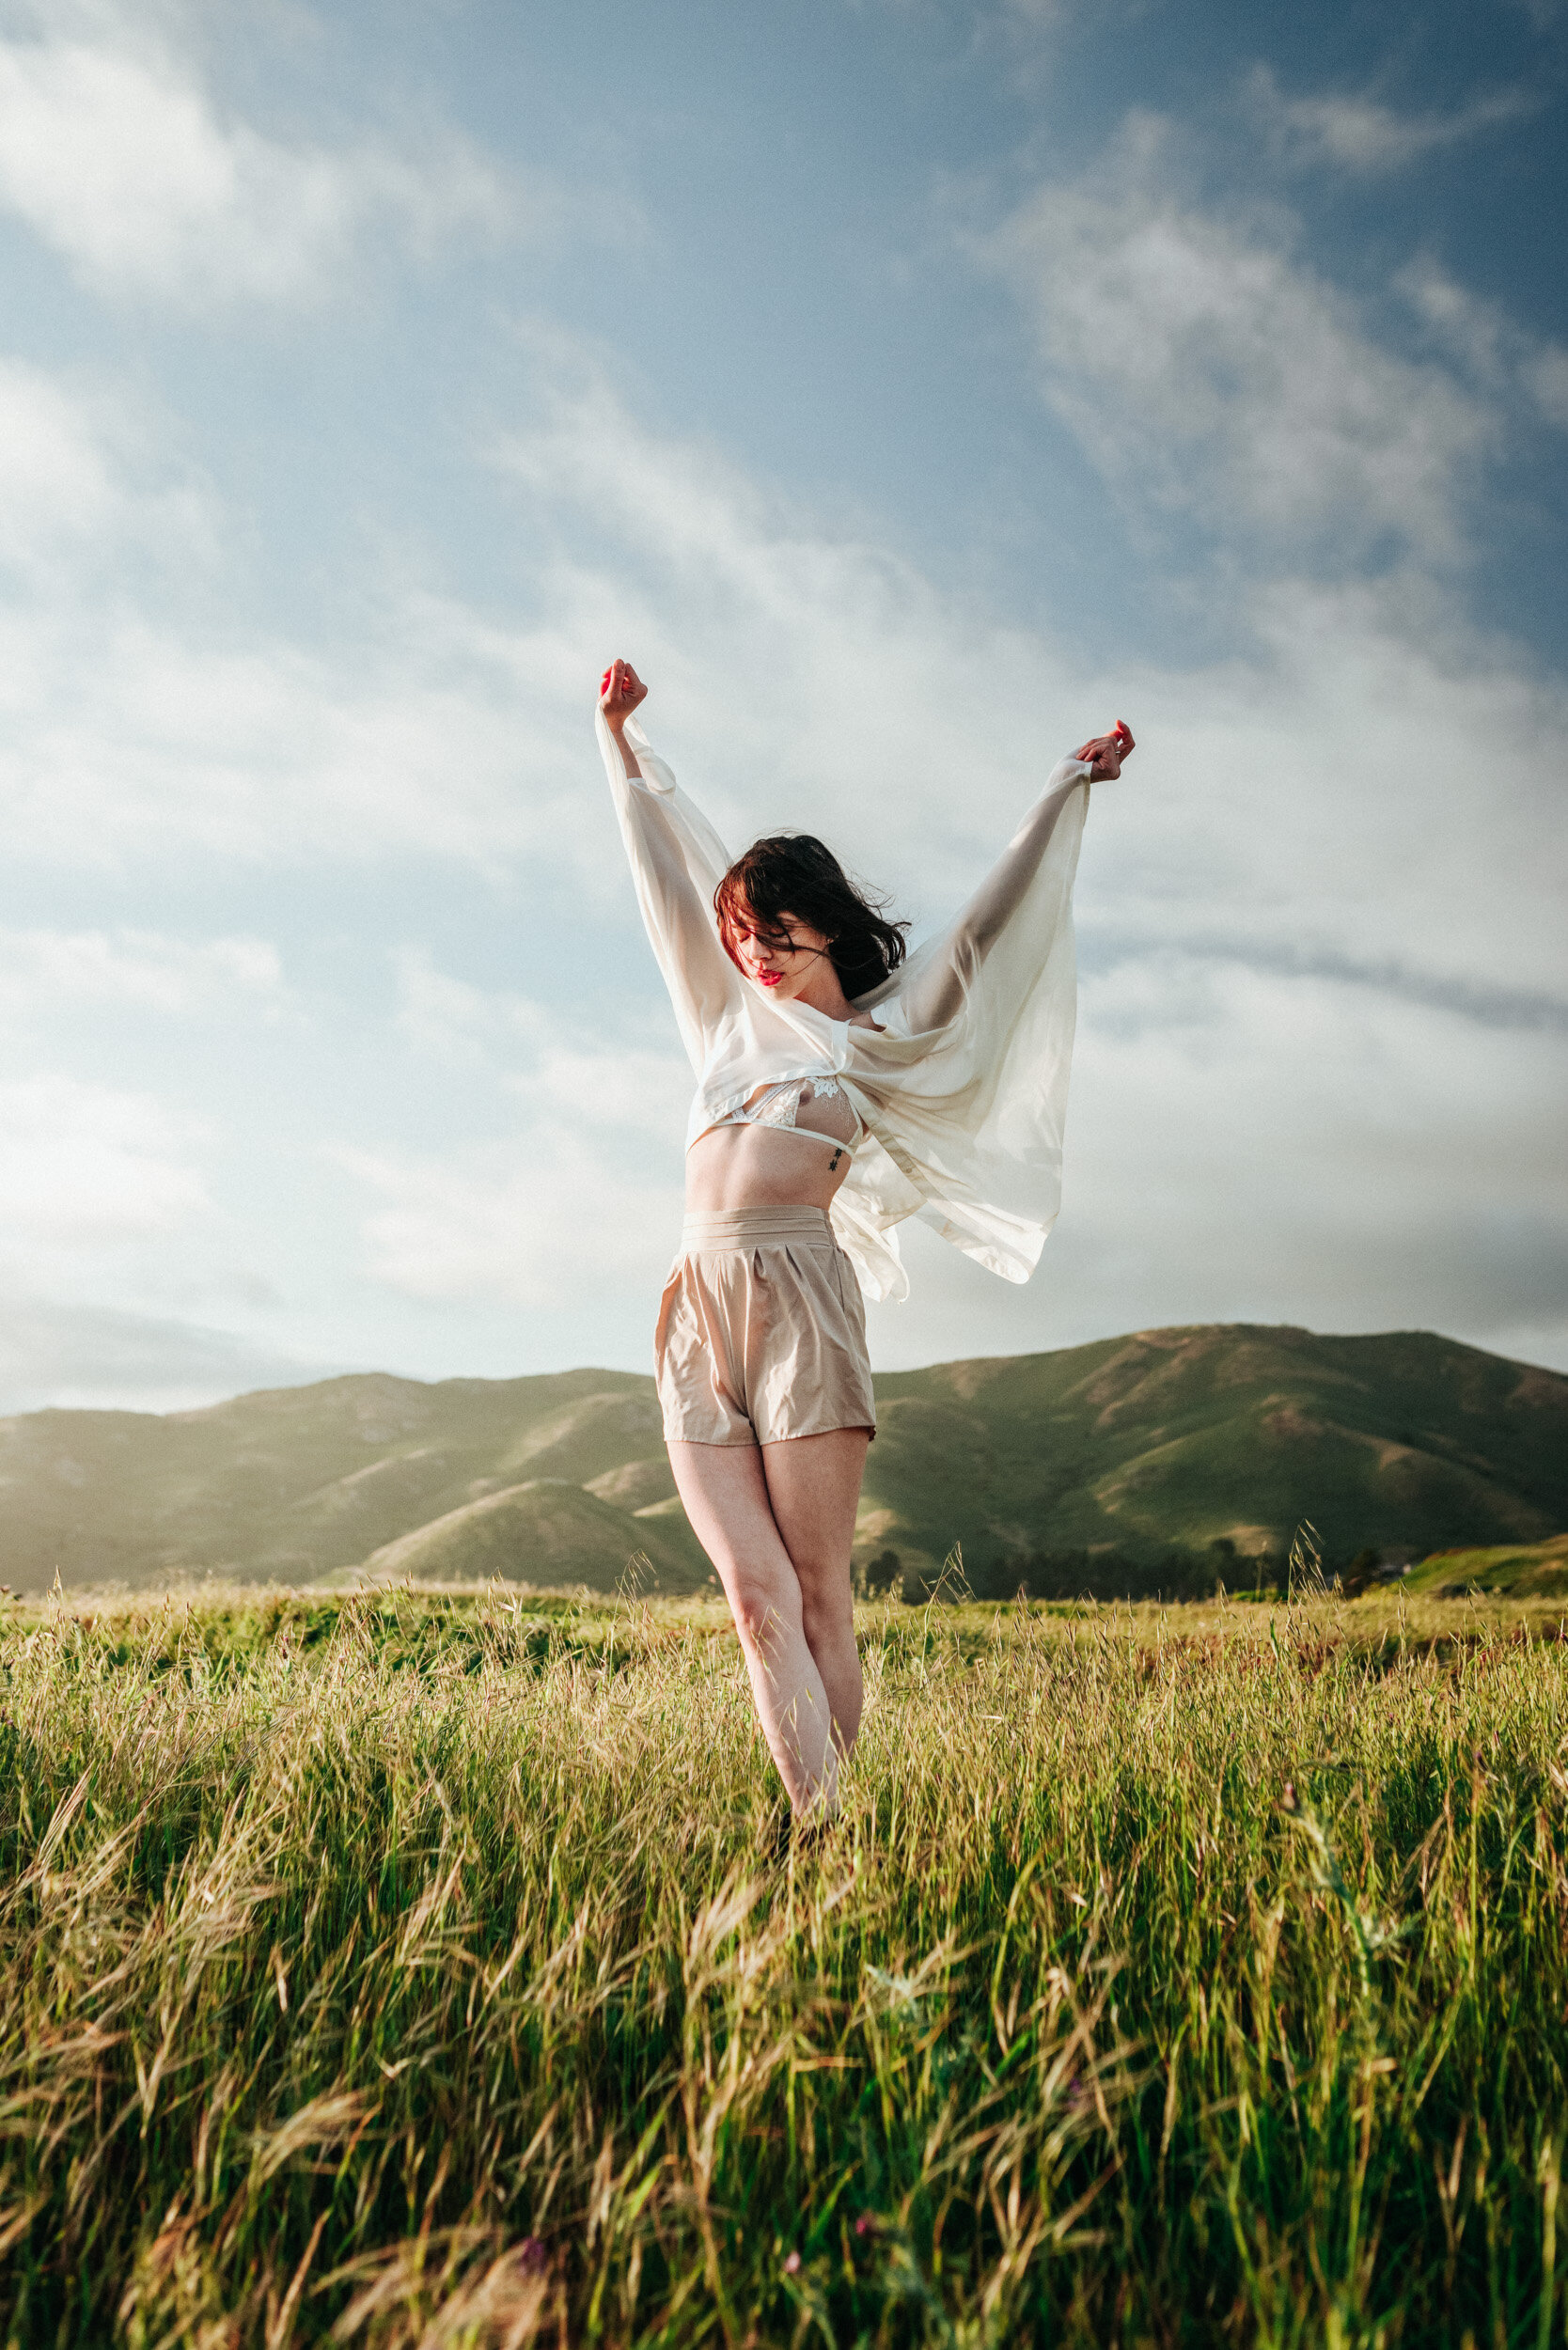
Above are the top 5 photos on my page ordered by total engagement, according to Instagram. And below are the next 5.
When I stated my Instagram I never thought it would end up the way it did. I did want to grow my account but I always thought it would be for art or for landscape photography. From the start it wasn’t a numbers game. It was more creating a photo that would leave an impression.
I think I’ll start off by explaining how I run my page, since I’m pretty sure there isn’t much interest in those long term statistics that I took (Mostly made those for myself).
First thing is posting. I know a lot of people have their own strategy for when they post and there is not a right way of posting, but this is what I do and its worked with me so far. I do not post on Friday and Saturday night, they have the lowest engagement for me. My guess is that its because people go out on those days and are not on their phones. I like to post twice a week, this allows a post to get all its engagement before it dies out. I do not post them too close together because the posts then take from each others engagement. Although, if a post is doing well I post another closer. I find that posting two good photos close to each other helps them pull each other up.
My posts usually fall on Sundays and Thursdays. Occasionally, when I do a third post, I post on Tuesdays. Morning works the best for me. This allows people to see it throughout the day and then get another bump in engagement overnight. A good portion of my following is outside of the US, they tend to be more active at night. Sometimes the engagement on my posts doubles overnight just because of this.
The style of photos also helps out. For my following I notice that full body photos do the best. Everyone has their following and what they likes varies. This is what I’ve found does the best for me. Looking at the top 10 photos helps because almost all of them are full body and have low angles or different creative posts. Closer more head-shot style portraits used to do the best but they have been doing worse which is why I don’t post them often anymore.
The next thing I want to talk about is promotions. I do promotions for my presets and to bump my engagement. I don’t do them often because I don’t really believe they work to well. I only do them because I have something to promote where I get money back. I do not think that using them is really helpful. When engagement is low or I don’t have much content, I use promotions to keep the momentum.
I think the real only way to grow a page is to post consistently. Both in the way you post and the content you post. I know sometimes doing things outside the box helps but people like knowing what they’re signing up for. People follow for consistency. I’m not going to talk about stories or captions because I’m not the best at either. I’m controlling about my page because I don’t like to see my work fail. Its a game and I don’t like to lose.
Last month, I wanted to map out my follower growth since I made my Instagram and posted my first photo. Since this is so far after the fact, there was no realistic way of me being able to map out everything from the start I remember there being a point where there was close to 1000 photos on my page. But Instagram didn’t have a way of archiving them so there’s no way for me to bring those back. Or to map out my first 1000 followers (which were honestly the hardest and took the longest). The only way I was able to track what I did was through screenshots that I happen to have of my page and screenshots I had from an app I used to track followers.
The first and probably the simplest graph that I made is the first one. The one above where I tracked the number of followers on my page from the day that I made it. There’s a lot that is not shown. The first thousand followers took me a couple of years, even after I got them I had a long period where it felt like I had a lot less. I changed the content on my page a couple of times that hurt my engagement. It wasn’t until I started to focus more on a single type of content that I really started to grow my page. at the end of 2016 I started taking portraits. Every other post on my page was a portrait and then mid 2017 I focused my content on only portraits. This one is the extended chart that goes from the start of my page but the others only show my engagement since the start of me focusing on portraits.
The red line on all of these charts shows the change in Instagram’s sorting algorithm. I’m not going to write about my opinion on it here because I already wrote a whole blog post on my thoughts about the algorithm. I noticed that since the algorithm took over, my overall engagement became less stable. Although there is not much that I can say about it since my page was not that well established at that point.
The chart above shows the likes and saves on each of my posts (since I started posting portraits). That chart doesn’t really say much. The only noticeable thing on this one is the instability that happened after the algorithm change. Since then there hasn’t really been any stability or any noticeable spots. Large spikes in the chart do not show anything since they are random. They do not help me notice when to post or when something is trending up. Most of the time when they do spike, it isn’t right when I post it. When my posts do better its over the course of a week or two. The posts just continue to get seen through ways that various ways that Instagram doesn’t tell you. When you check where the impressions come from, Instagram just says “other” for most of them.
The bottom shows the percentage of saves to likes. I chose percentage because this matters more than just the numbers. Some posts don’t get viewed as much so it is harder for them to be compared. Newer posts are seen by more people because I have more followers than I had on older posts. This one actually has a bit more of a trend, where newer posts are gaining more attention than older posts. I took a small trip to LA in October and I think that helped fuel my creativity after I was in a small rut (which can actually be seen). All of the times I had a bad time creatively can be seen on here, where there was a drop in my content.
The one below shows the number of likes to number of followers. The most noticeable trend is the high number of followers gained on the high spikes. The number of followers go up because a lot of the times the people that like those photos are not already following. Then when posts get less frequent, there little to no growth. The winter 2018 semester was busier which meant I had less time for photos. Following that I also had a rough start to 2019 which also slowed down my growth.
One of the things that I like to do to run my page is archive photos. I don’t find keeping a high amount of photos on my page really necessary. I keep the number of posts on my page below 300. Having a lot of posts does not help in my opinion. People do not look far back on my page. Even with below 300, I rarely see anyone like photos that are older than maybe half of the number on my page. I remove posts for various reasons, aesthetic, variation, consistency and engagement are some of the reasons. On the chart on the right there are some of the stats for my archived posts to my non-archived posts. Posts that are archived have noticeably worse engagement. That could be because some of them do have worse engagement but more because most of them are older.
Below is the same graph as the previous one, only this one has the archived posts on their own line.
The one below is engagement. This is probably the most important one. This shows that the number of followers you have is actually looking at your content. Although if there is anything that I’ve learned, its that this goes down with a higher following. I’ve always thought that 10% is a good amount of engagement. I’ve been lucky enough to get higher engagement on some posts, even one that is over 100%.
Sorry for the small graphs. There wasn’t a way for me to keep them visible and wasn’t able to find a fix.
